Comment On Web Pages And Send To AI
Drop numbered comments directly on any page in the built-in browser, then bundle them into a single AI prompt with element refs, screen position, route, and screenshots attached.
More Screenshots
Click any image to zoom in
Why You Need This
How this feature boosts your daily productivity
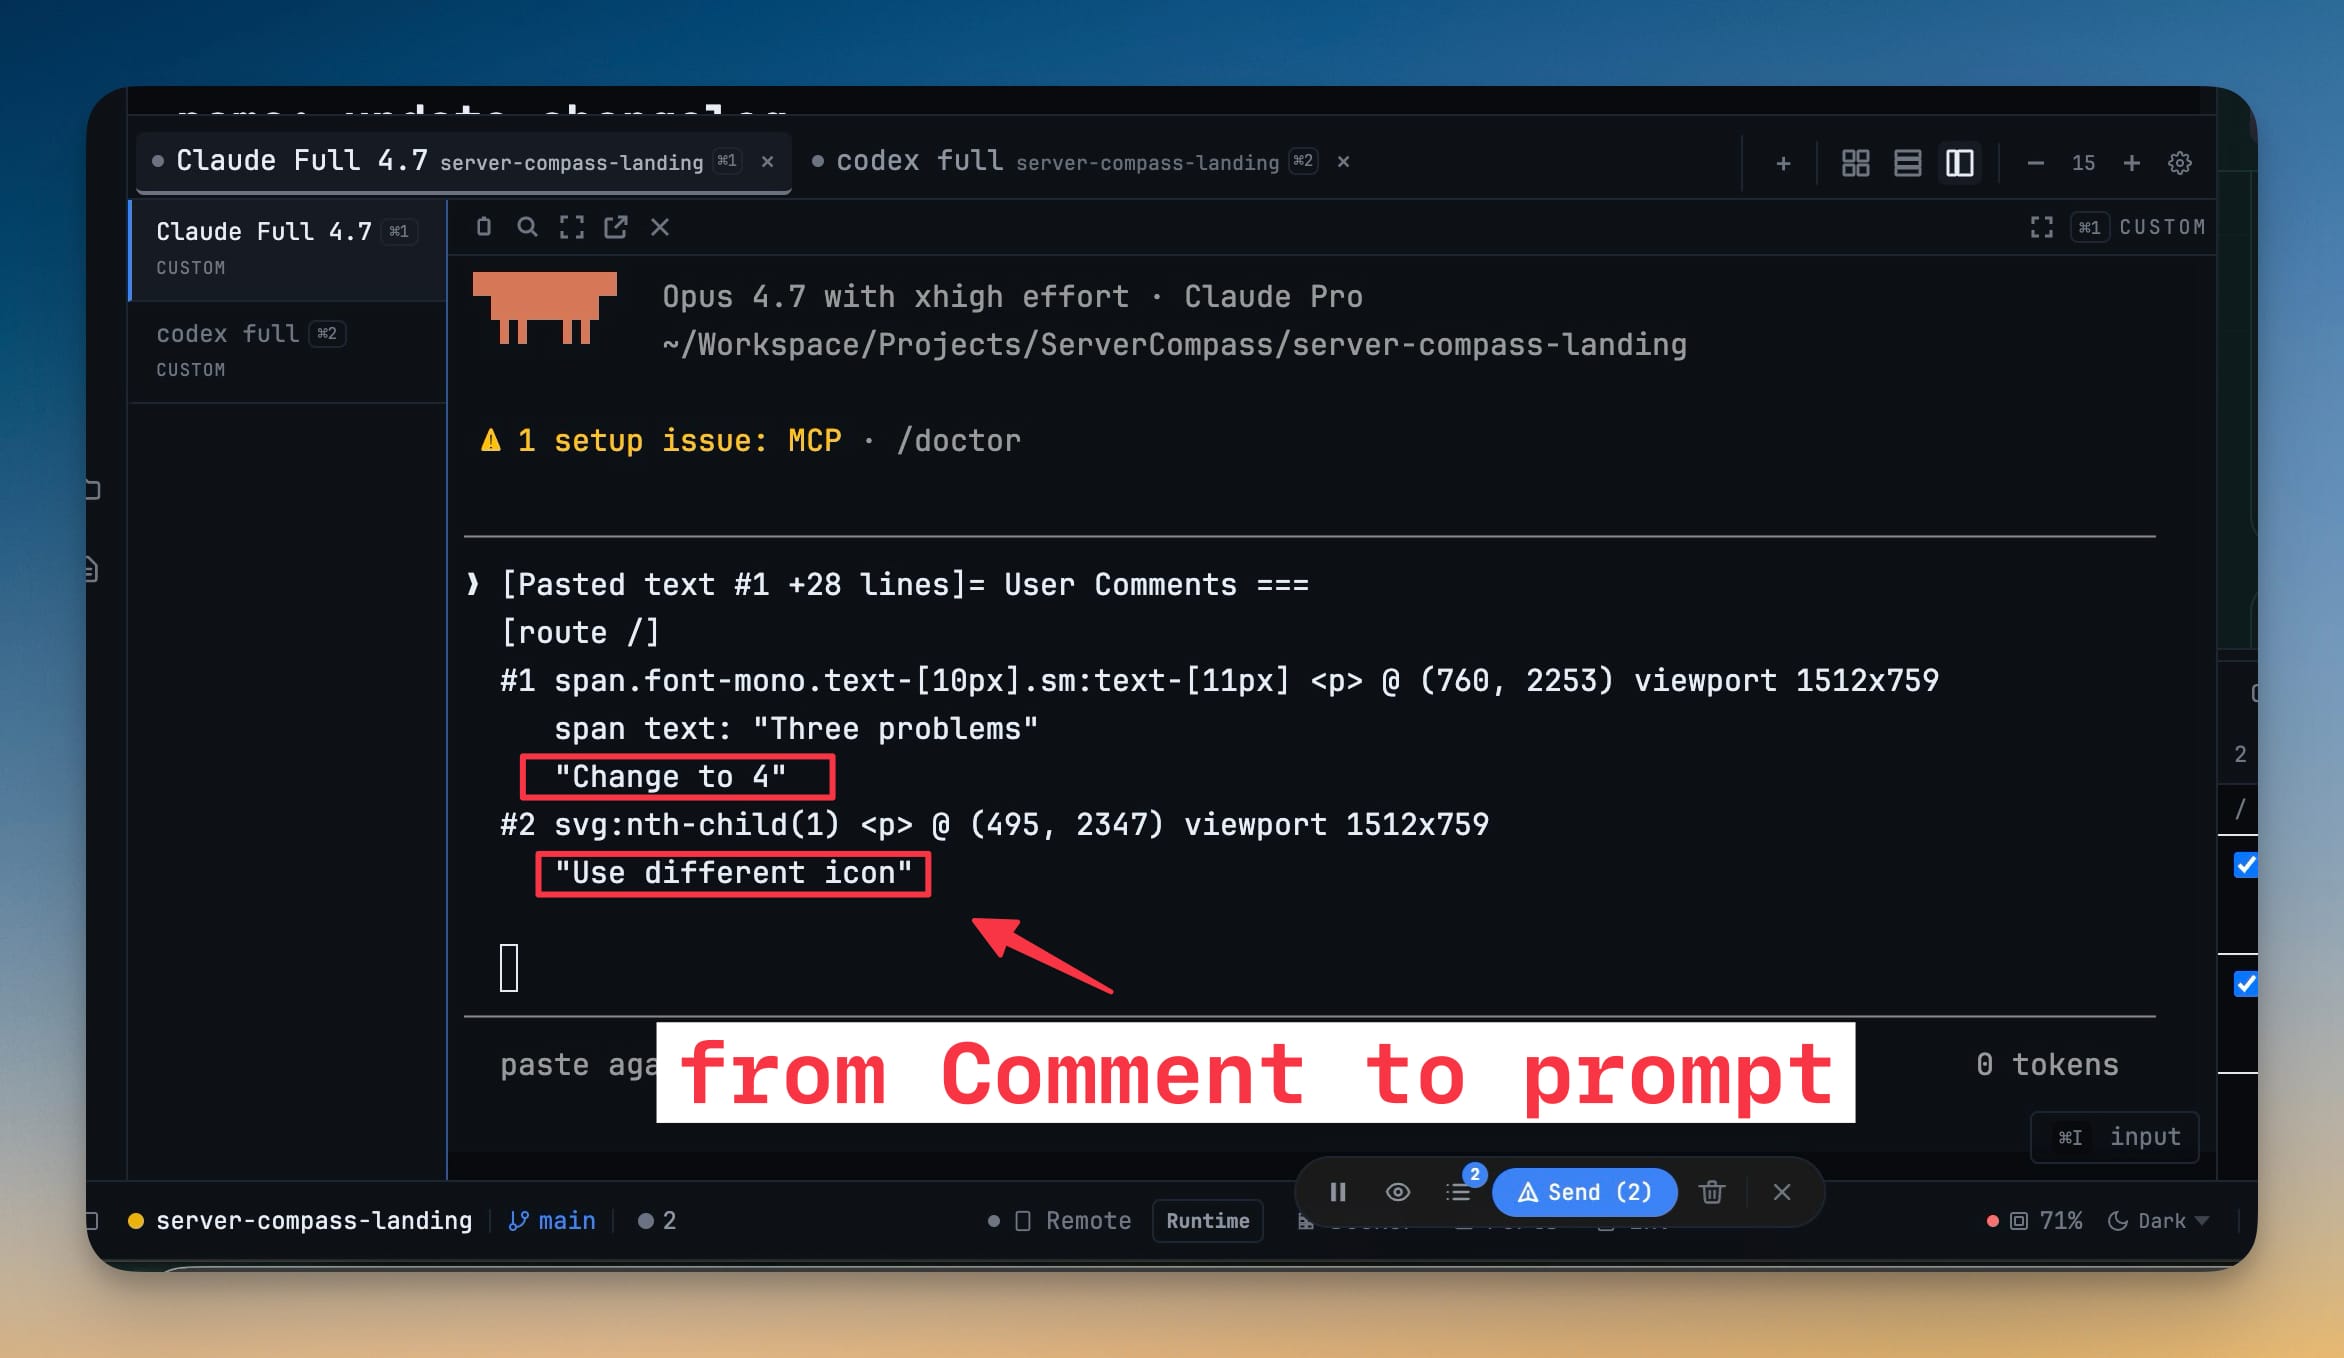
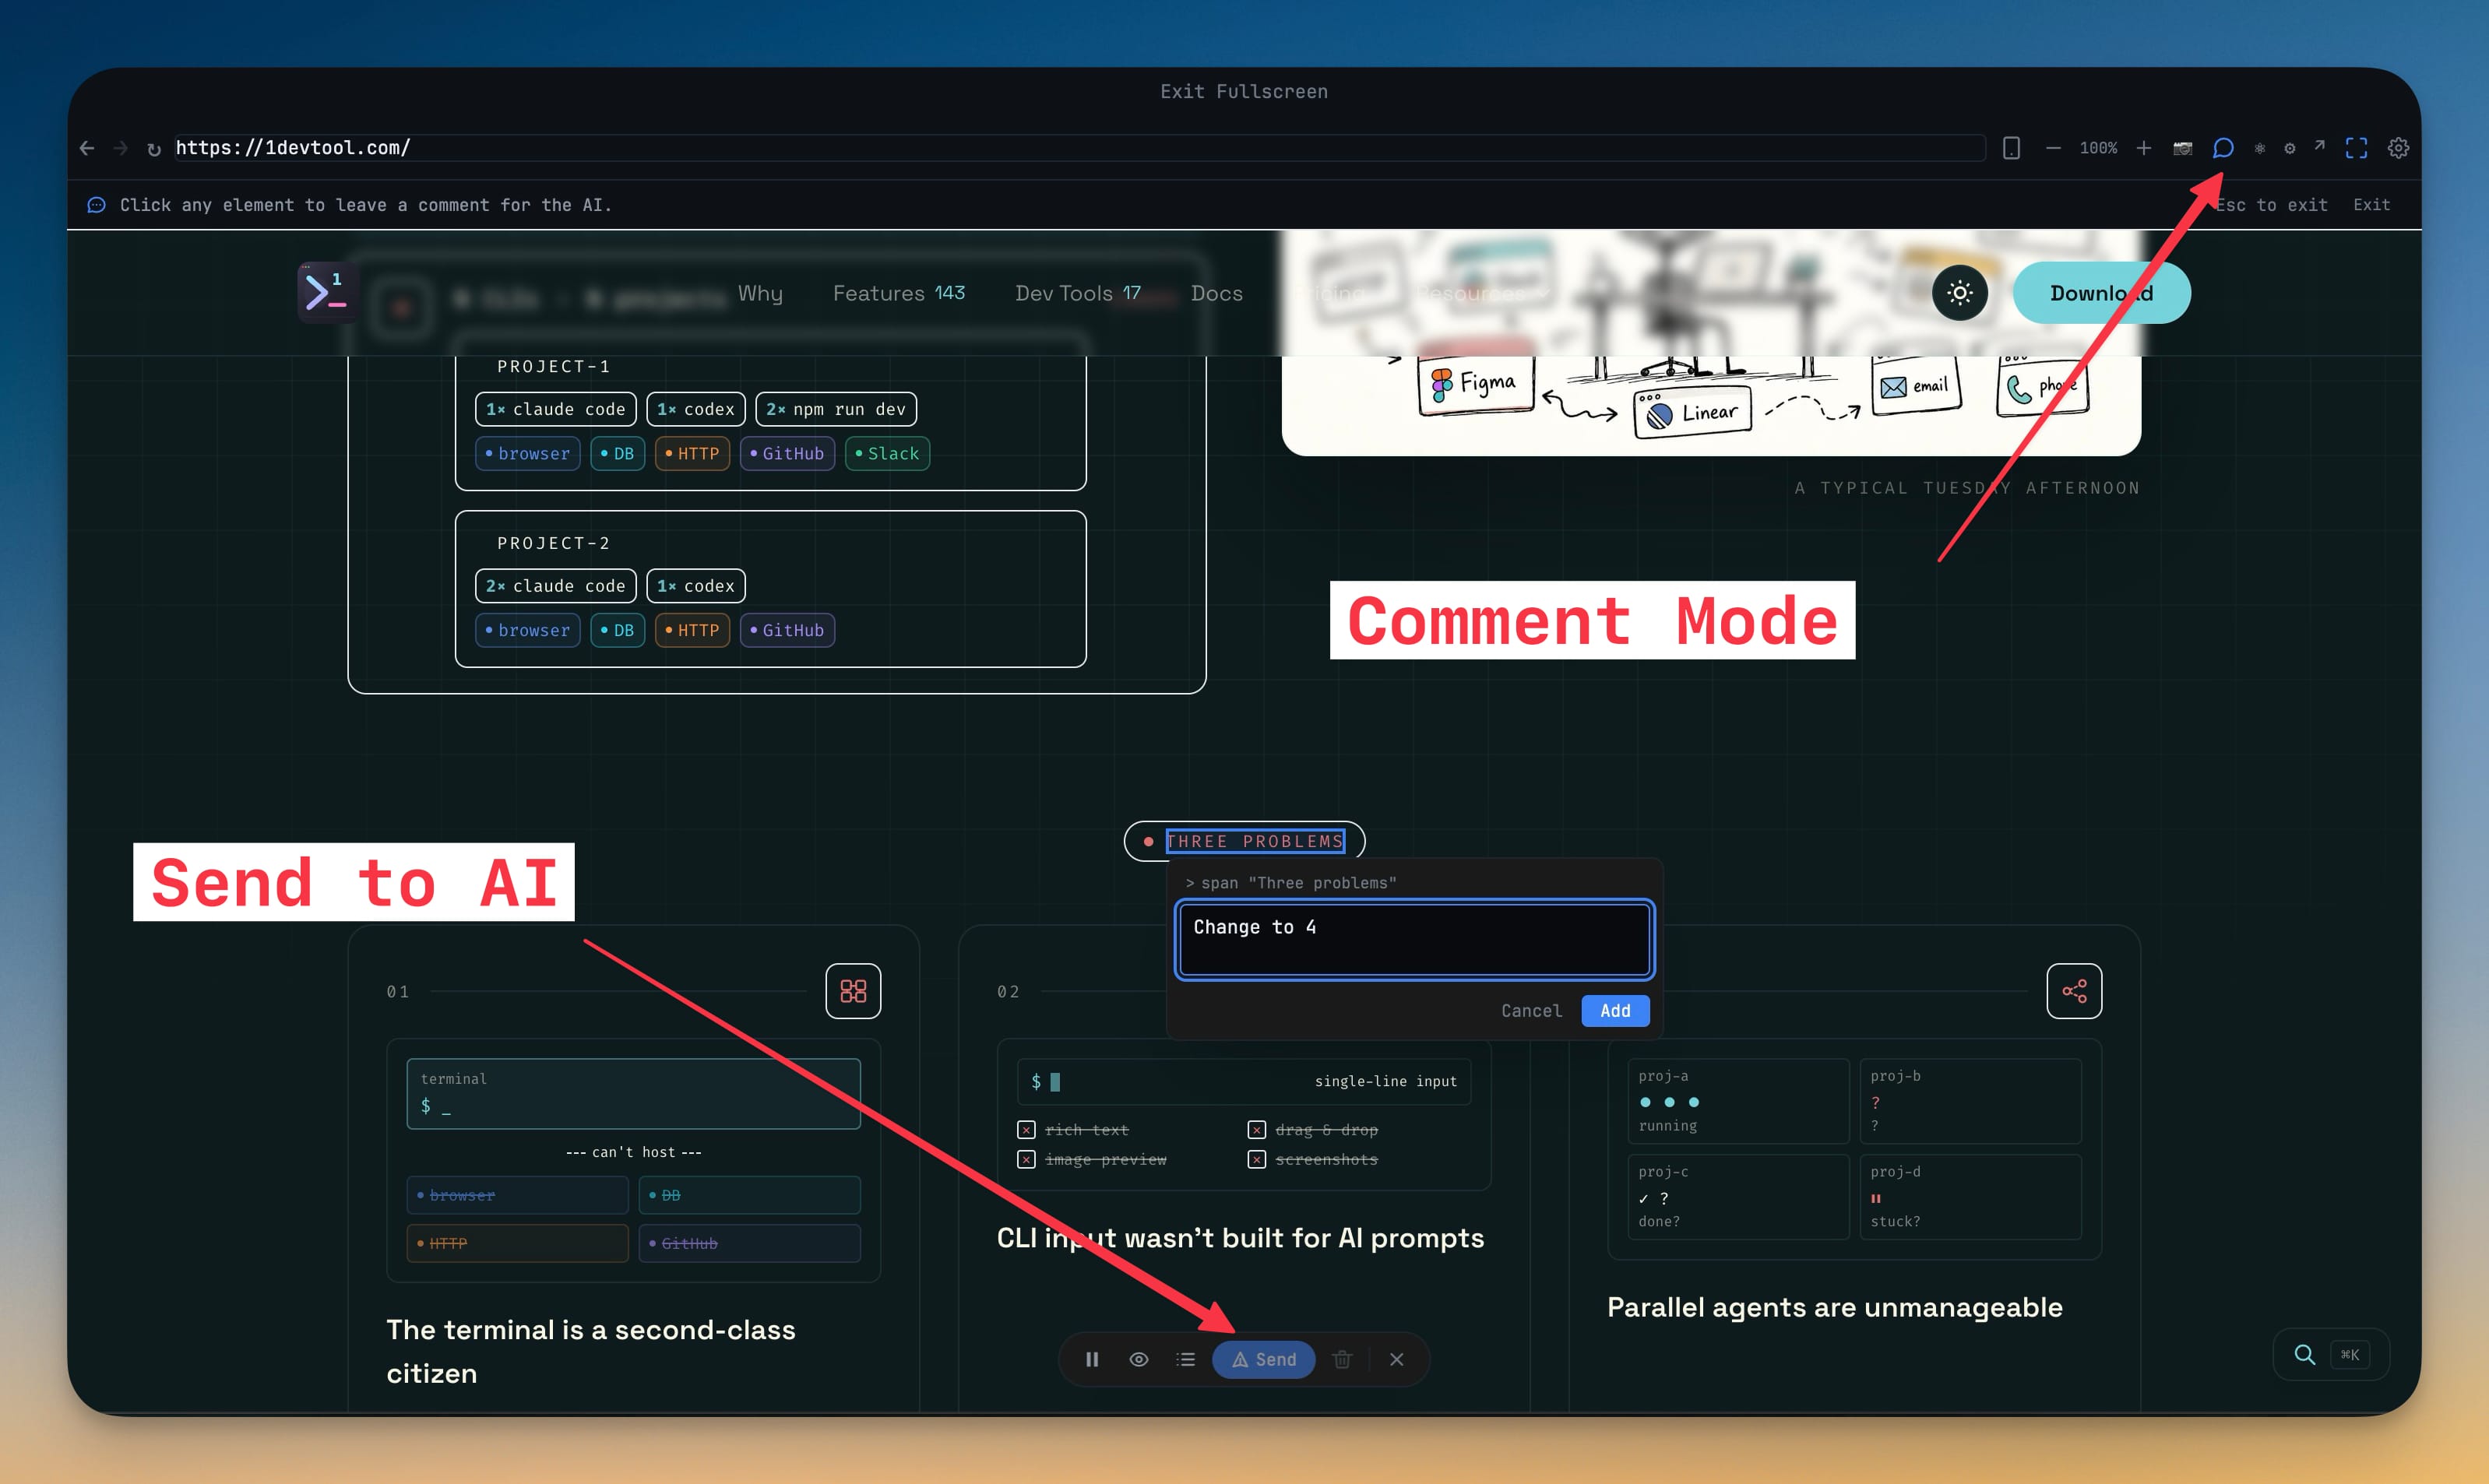
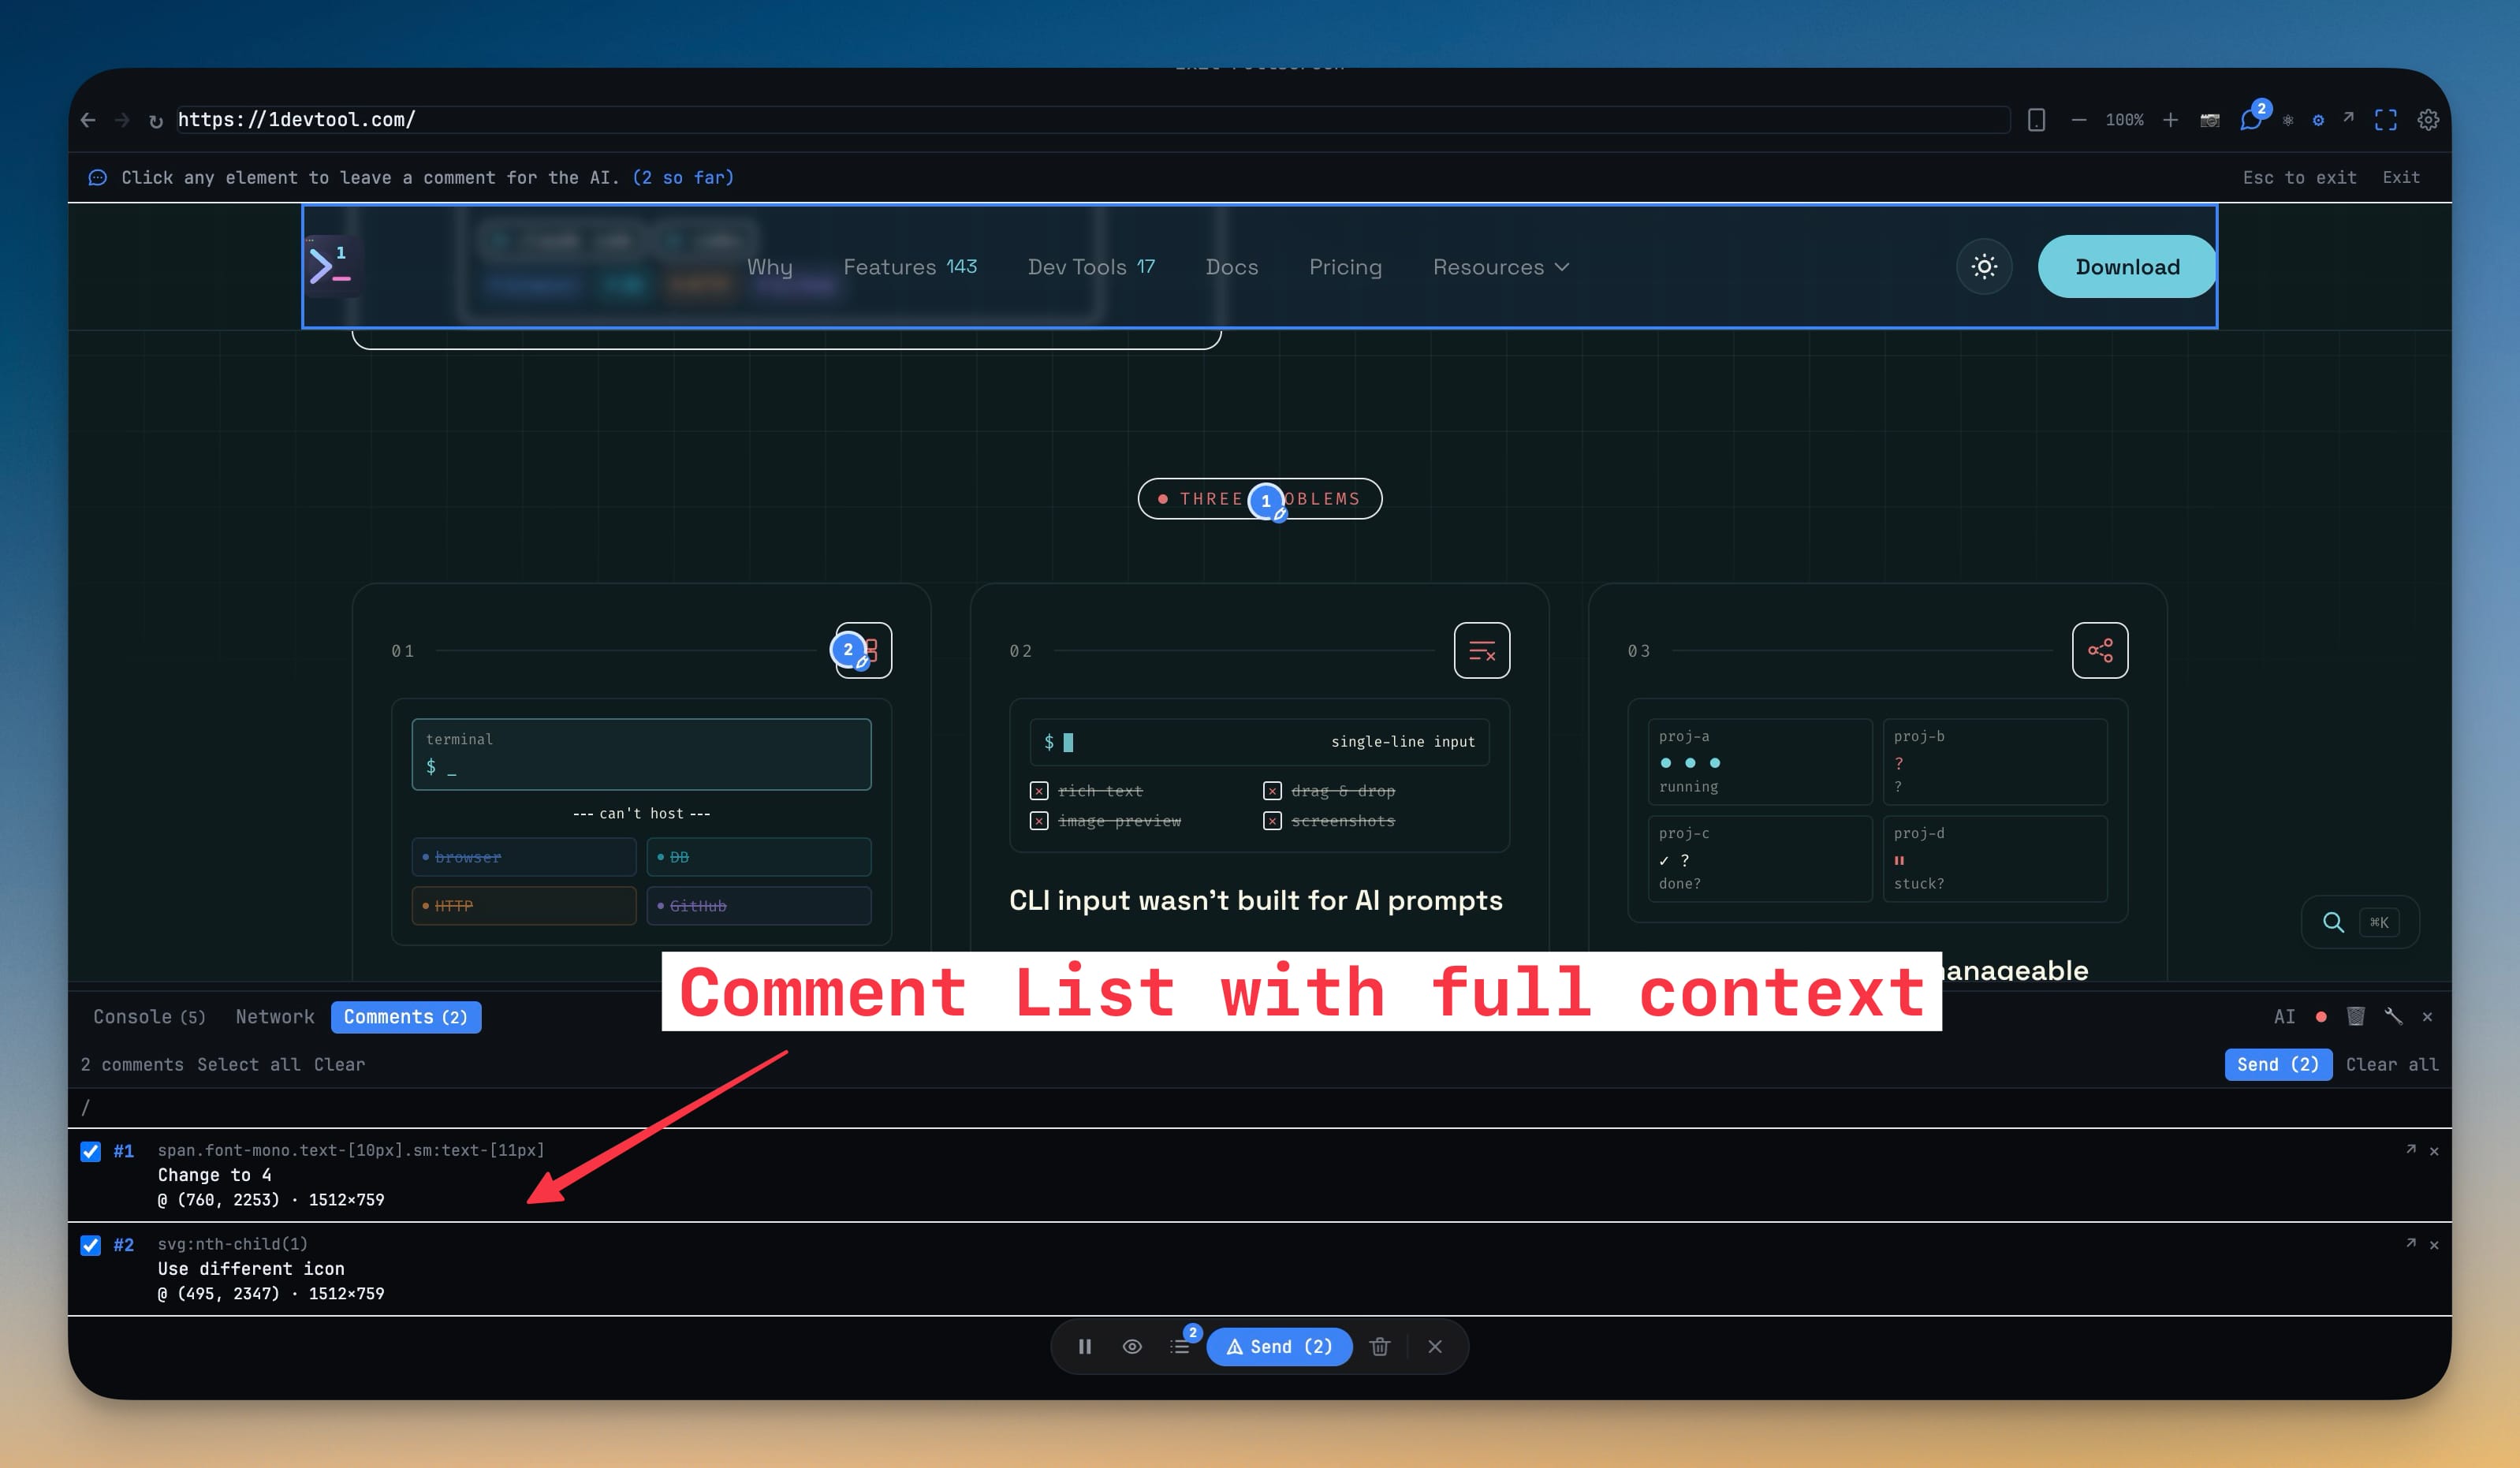
Describing a UI bug in text loses the most useful information — exactly which element is wrong and exactly where on the page it sits. By the time you paste three screenshots into an AI agent prompt and type vague references to each, the agent is guessing. With browser comments, you point: drop pins on the broken elements, group them by page in the Comments tab, and send the whole bundle as one structured prompt. The agent gets element-aware, position-aware feedback — not a paraphrase of what you saw.
How It Works
Get started in 4 simple steps
Set Your URL
Enter your local dev server URL or set a default per project. The browser loads your app instantly.
Navigate & Test
Use back, forward, and refresh controls. Open multiple tabs for different routes or states.
Debug with DevTools
Right-click or use the keyboard shortcut to open Chrome DevTools. Inspect elements, network, and console.
Iterate Rapidly
See code changes reflected in the browser without switching windows. Your dev loop stays inside 1DevTool.
Without 1DevTool
The manual way vs. the 1DevTool way
The Hard Way
The 1DevTool Way
Key Capabilities
Everything included with Comment On Web Pages And Send To AI
Why It Matters
The productivity impact of having browser preview built into your workspace
Tighter Dev Loop
See changes instantly without alt-tabbing to Chrome. Your code, terminal, and preview live in one window.
Built-in DevTools
Full Chrome DevTools for network, console, and DOM inspection. Debug without switching apps.
Multi-Tab Preview
Preview multiple routes or states simultaneously. Compare the login page and dashboard side by side.
Per-Project URLs
Each project remembers its default preview URL. Switch projects and the browser loads the right dev server.
More in Browser Preview
Other features in this category you might find useful
Embedded Browser
Preview your local dev server with a full browser — URL bar, tabs, back/forward, and refresh controls.
DevTools Access
Open Chrome DevTools for network inspection, console debugging, and element inspection inside 1DevTool.
Live Browser Automation
Let an AI agent drive the Browser panel you already have open — same tabs, same navigation history, same signed-in sessions. Sixteen browser_* MCP tools cover navigating, clicking, typing, reading the page, and screenshotting, all scoped to one project and tab.
HTML File Preview in the Browser Panel
Right-click any `.html` or `.htm` file in the file explorer and pick **Open in 1DevTool's Browser** to render it inside the built-in browser panel — ideal for previewing static sites, build artefacts, exported reports, or scratch HTML. The same context menu pair (in-app browser or your system browser) is also available for PDFs, audio, and video files.
Ready to boost your workflow?
Download 1DevTool for free and experience Comment On Web Pages And Send To AI along with 170 other features — all in one app.