Sep 14, 2026
See What Your AI Agents Actually Did This Week
Analytics in 1DevTool 1.74.0 turns the session logs, prompt history and git already on your machine into a local recap of your agent work — sessions, tokens, estimated spend and parallel runs — plus a shareable card that carries aggregate numbers only.
You ran agents all week. Claude Code in one pane, Codex in another, a Devin session you left churning overnight while Cursor picked through a refactor. By Friday you know it was a lot. Ask yourself how much, though, and the honest answer is a shrug. Every CLI keeps its own logs in its own format, the token counts sit in JSONL files nobody opens, and the only number you ever actually see is the one on a billing page at the end of the month.
That gap costs more than curiosity. You can't tell whether the agent you pay the most for is the one doing the work, whether your long sessions are the productive ones, or whether "I've been running four agents in parallel" is true or just how it felt. And when someone asks what working with a handful of coding agents really looks like, you have anecdotes instead of numbers.
What changed
1DevTool 1.74.0 adds Analytics: a recap built from the activity trail already sitting on your machine — the prompts you typed, the agent sessions you ran, the tokens they used and what those tokens would cost, your orchestration runs and your git history. Now you can see a week of agent work at a glance without exporting a log, building a spreadsheet or sending anything anywhere.
Press ⌘⇧A (Ctrl+Shift+A on Windows and Linux), choose Analytics… from the Navigate menu, or run Open Analytics from the Command Palette. The header reads computed on this Mac next to a Local only chip, and it means it.
How it works in practice
Start with the week at a glance
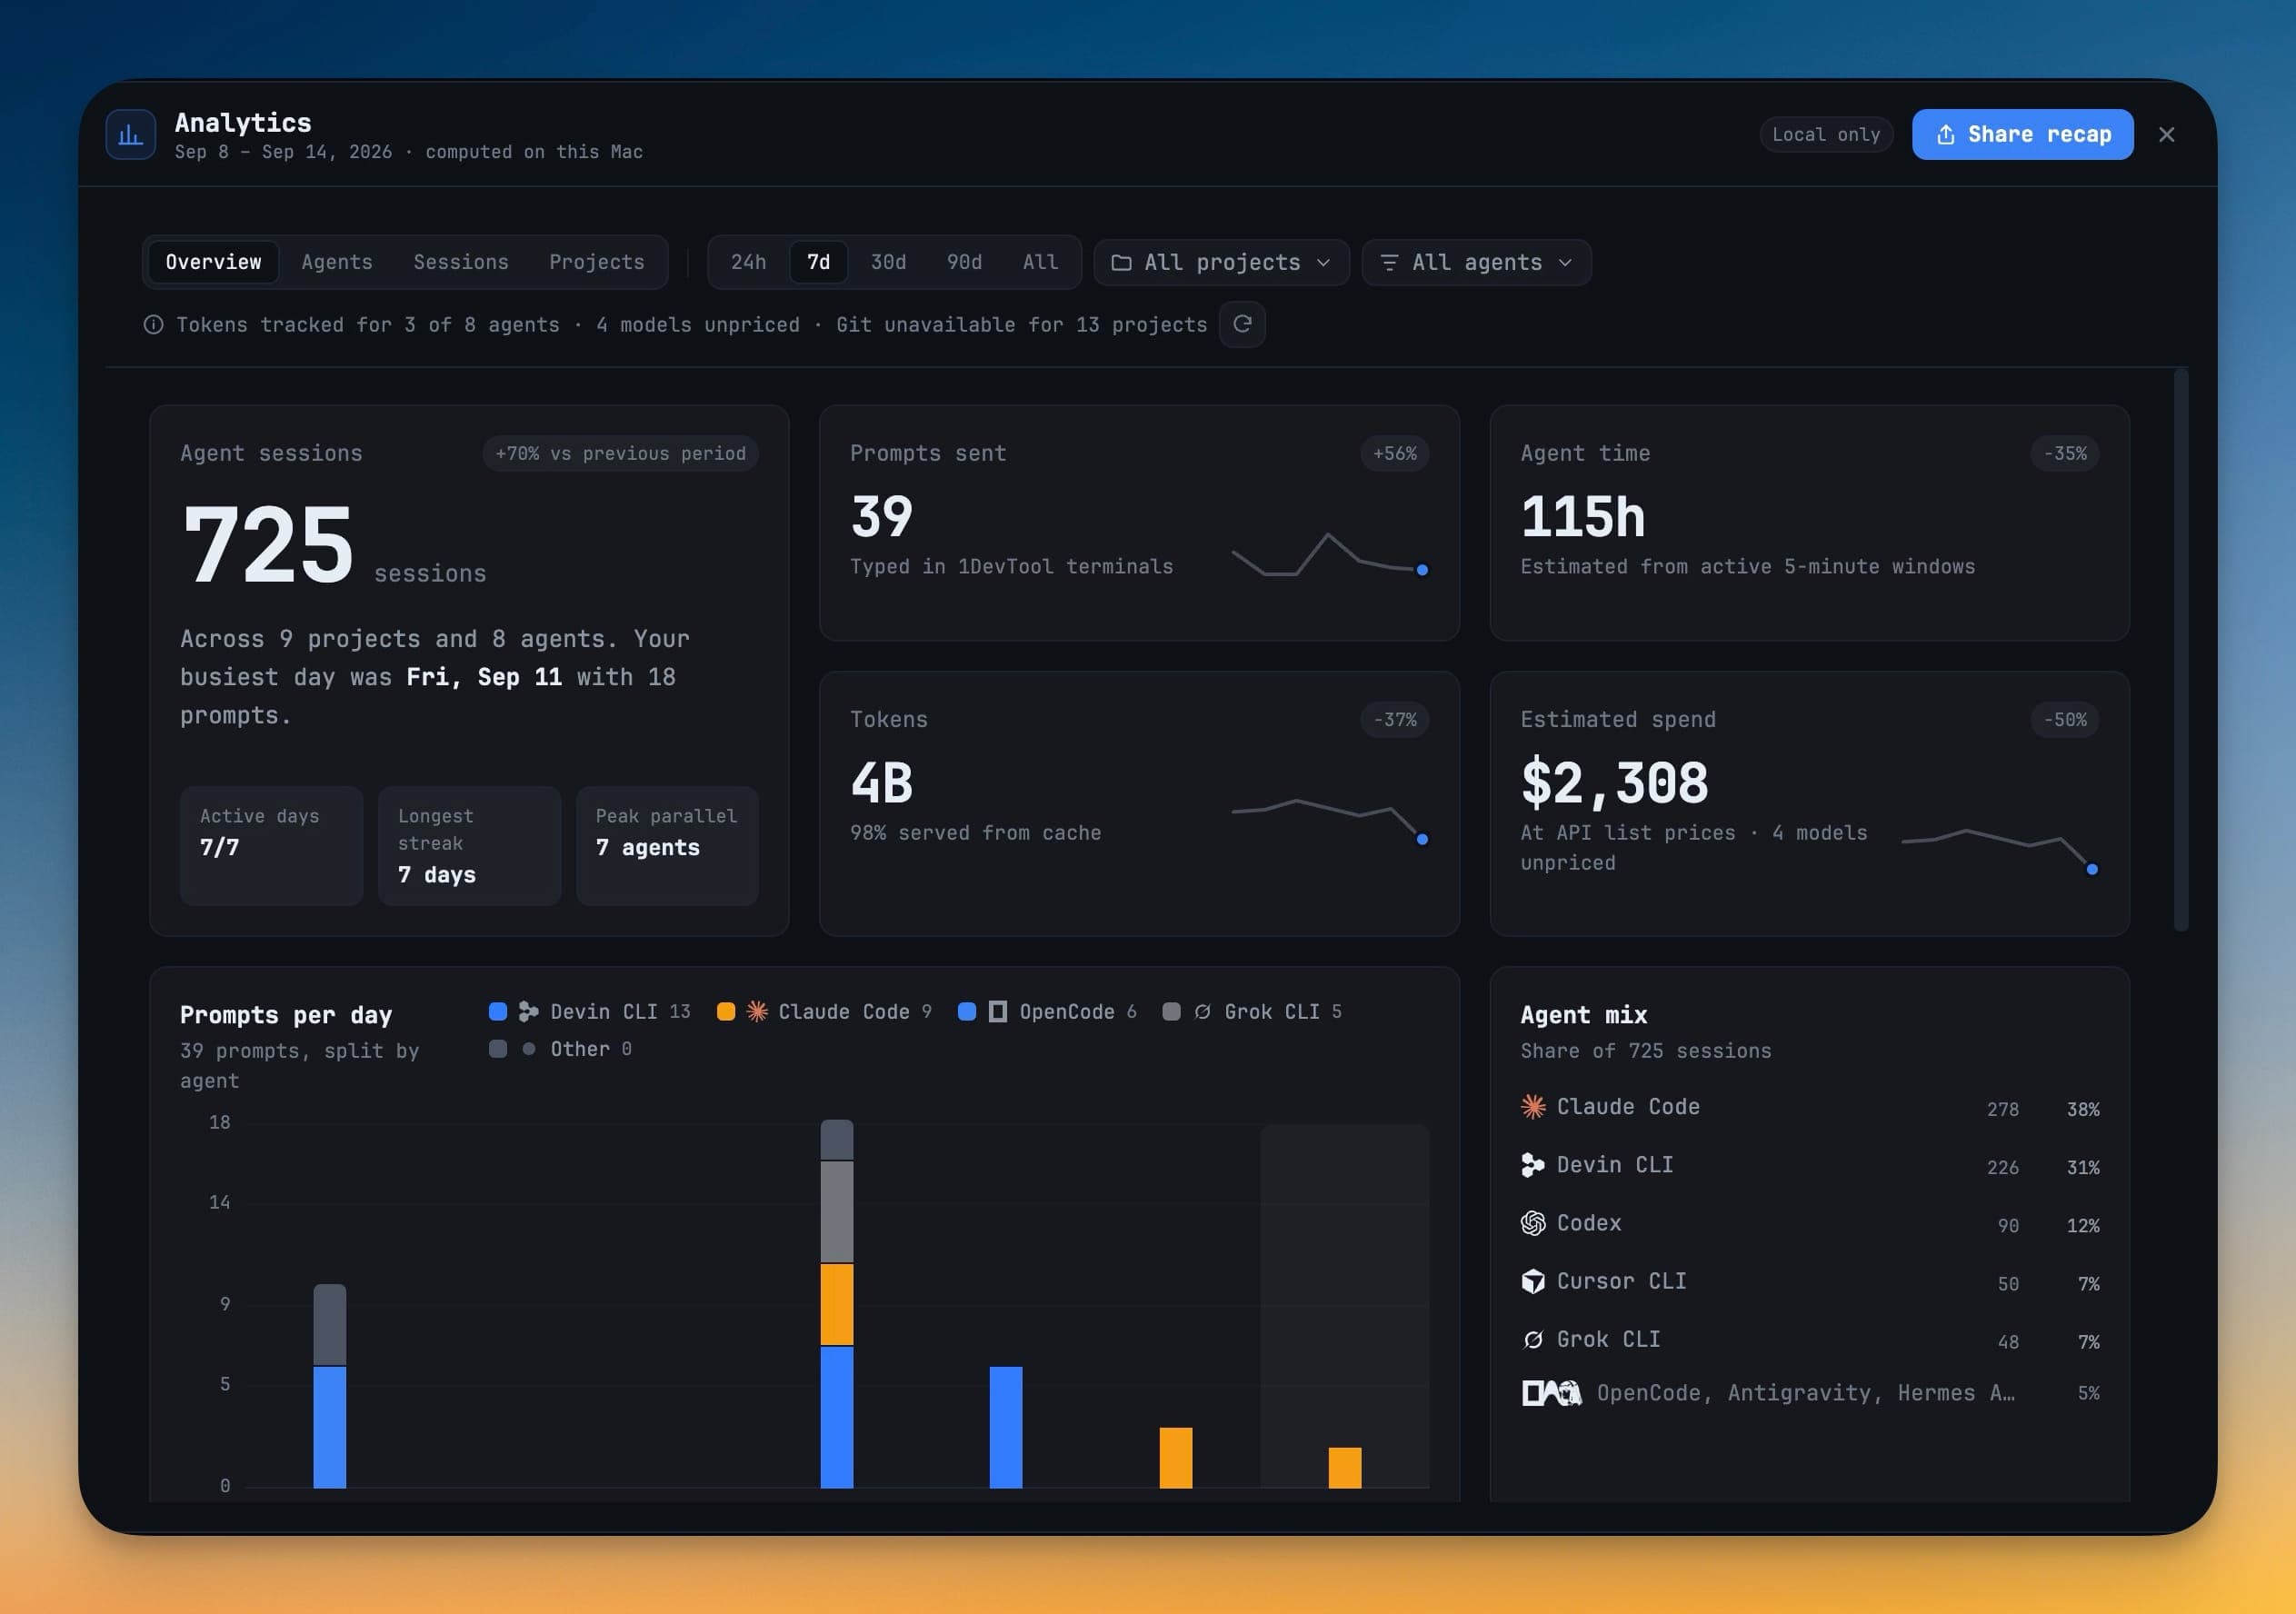
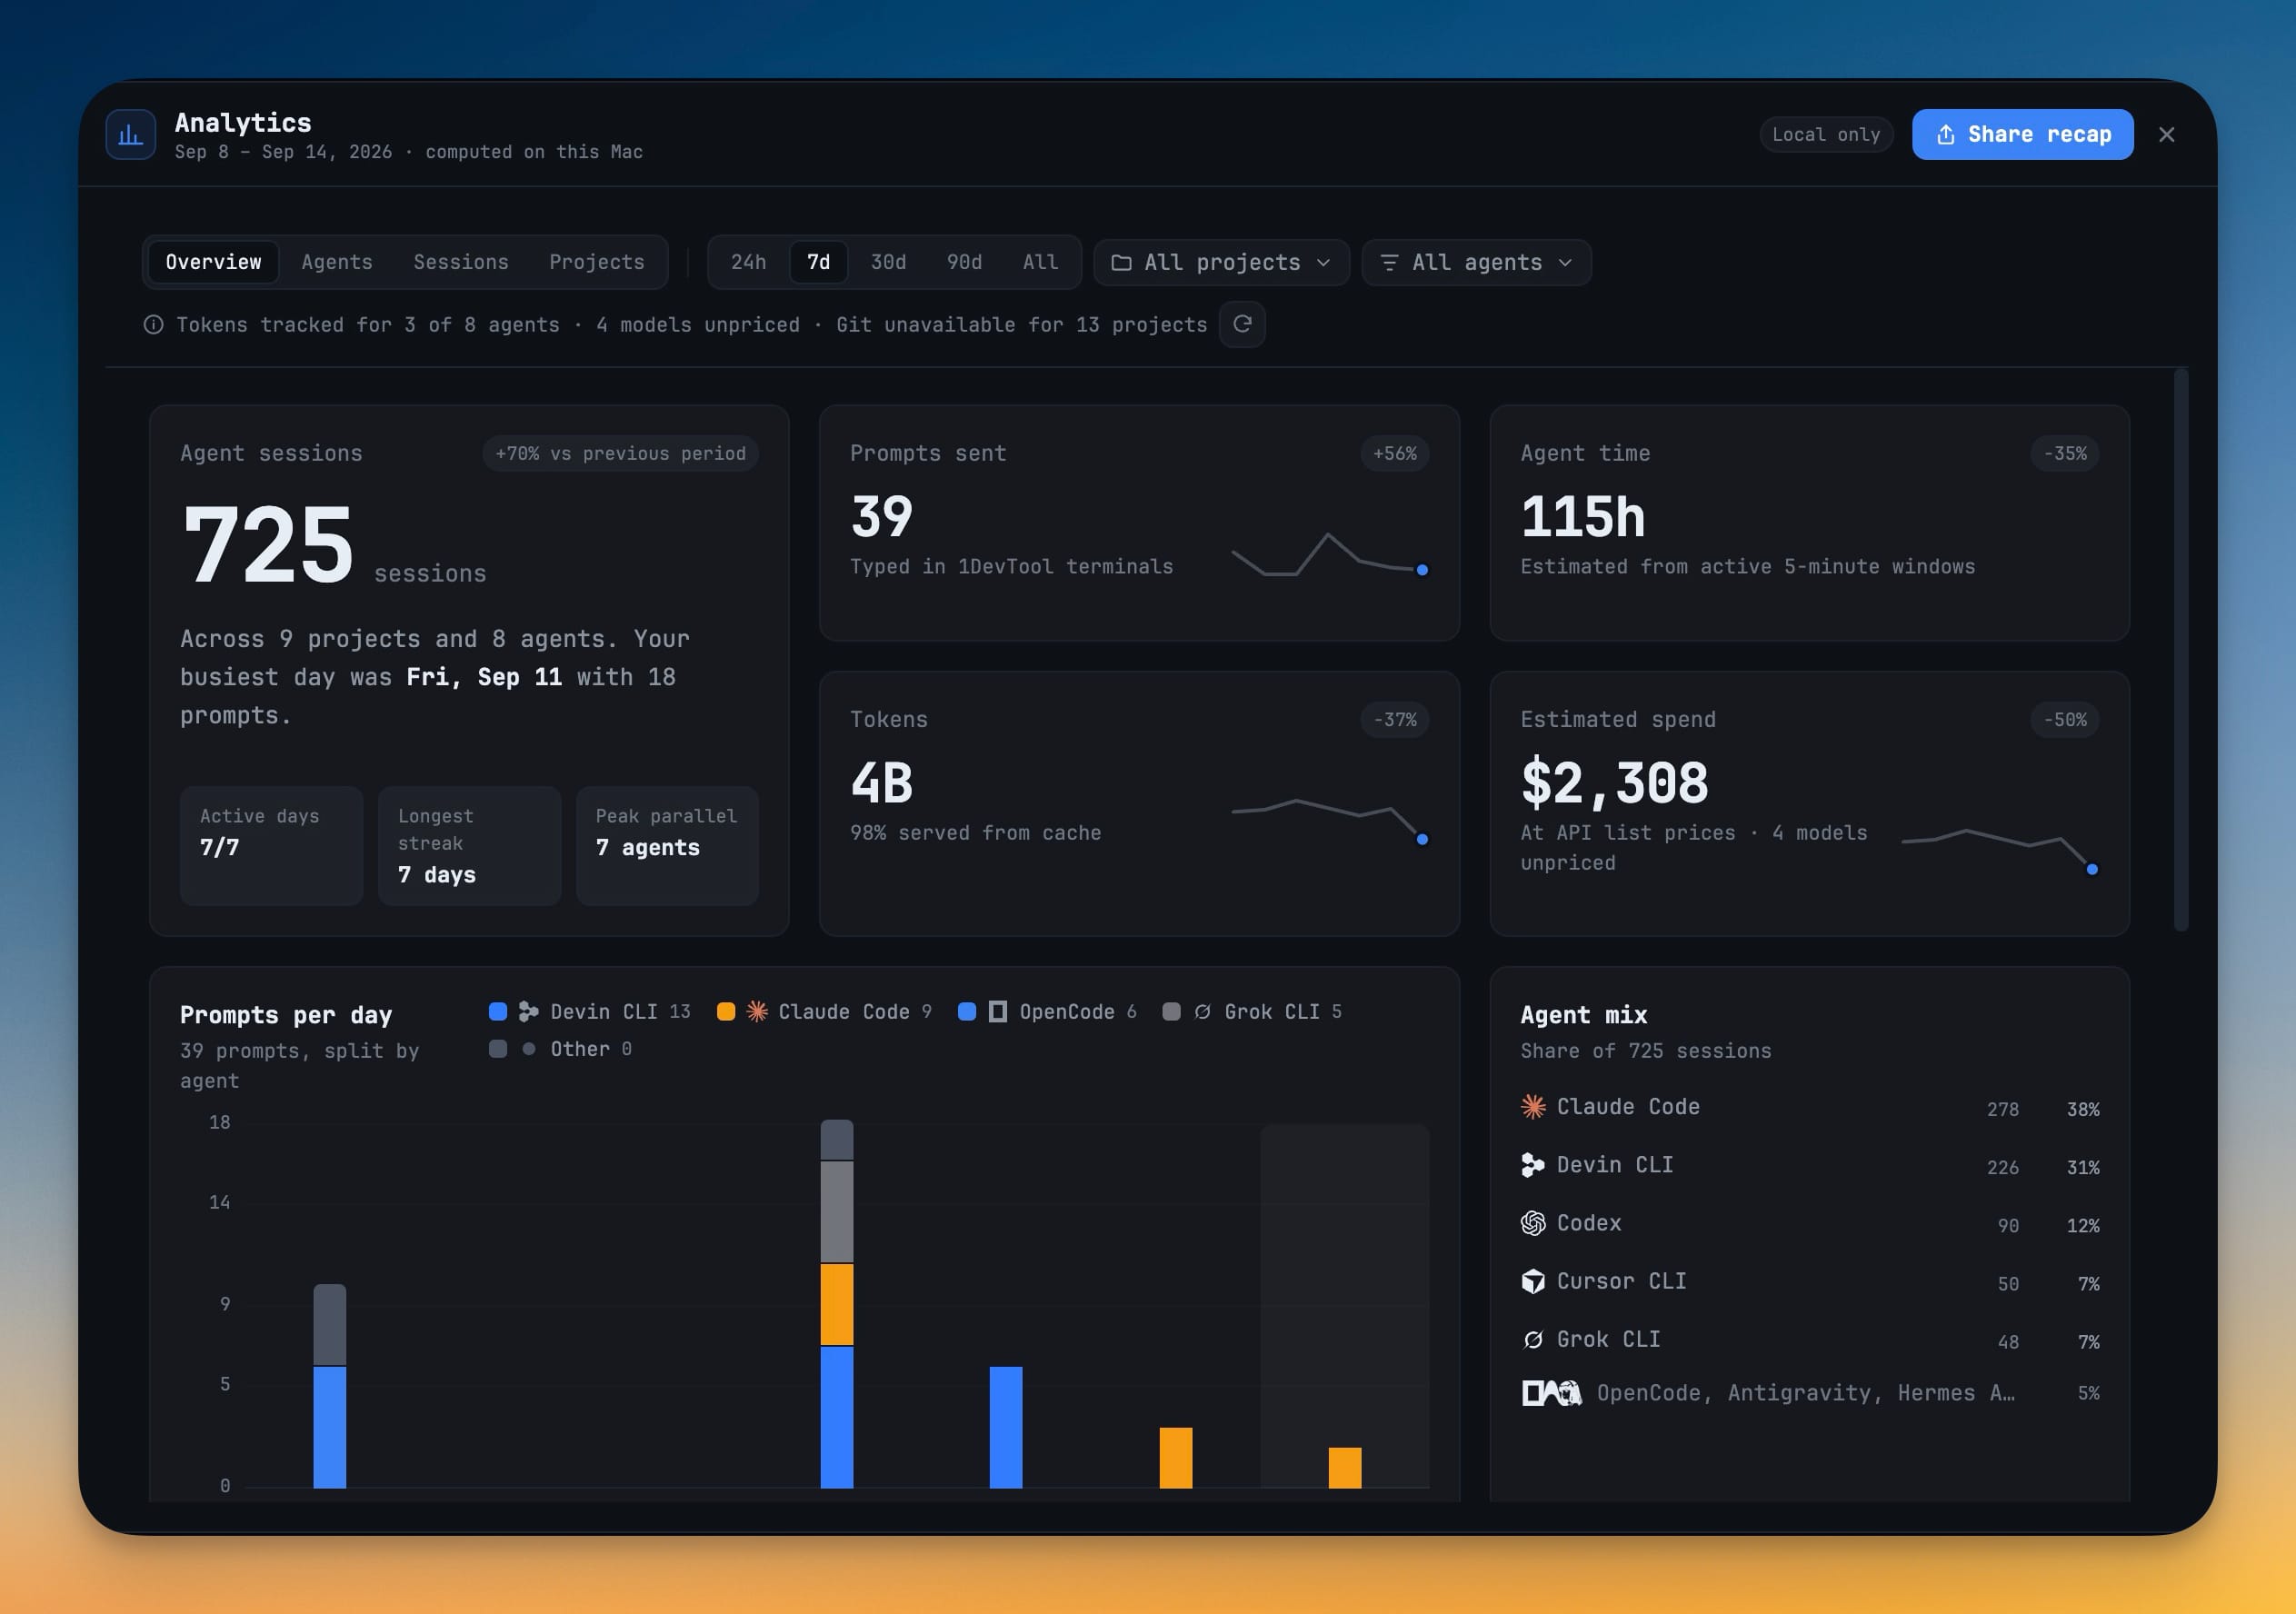
Overview answers "what happened?" before you go looking. The Agent sessions card gives you the count against the previous period, your active days, your longest streak and Peak parallel — the most agents you had running at the same moment. Beside it sit Prompts sent, Agent time (estimated from active 5-minute windows, not from how long a tab happened to stay open), Tokens with the share served from cache, and Estimated spend at API list prices.
Scroll down and the shape of your week shows up: Prompts per day stacked by agent, the Agent mix of your sessions, a When you work punchcard by weekday and hour, Top projects, Shipped — commits and lines added and removed, counted from git against your own author email with merges left out — and a Longest sessions table.
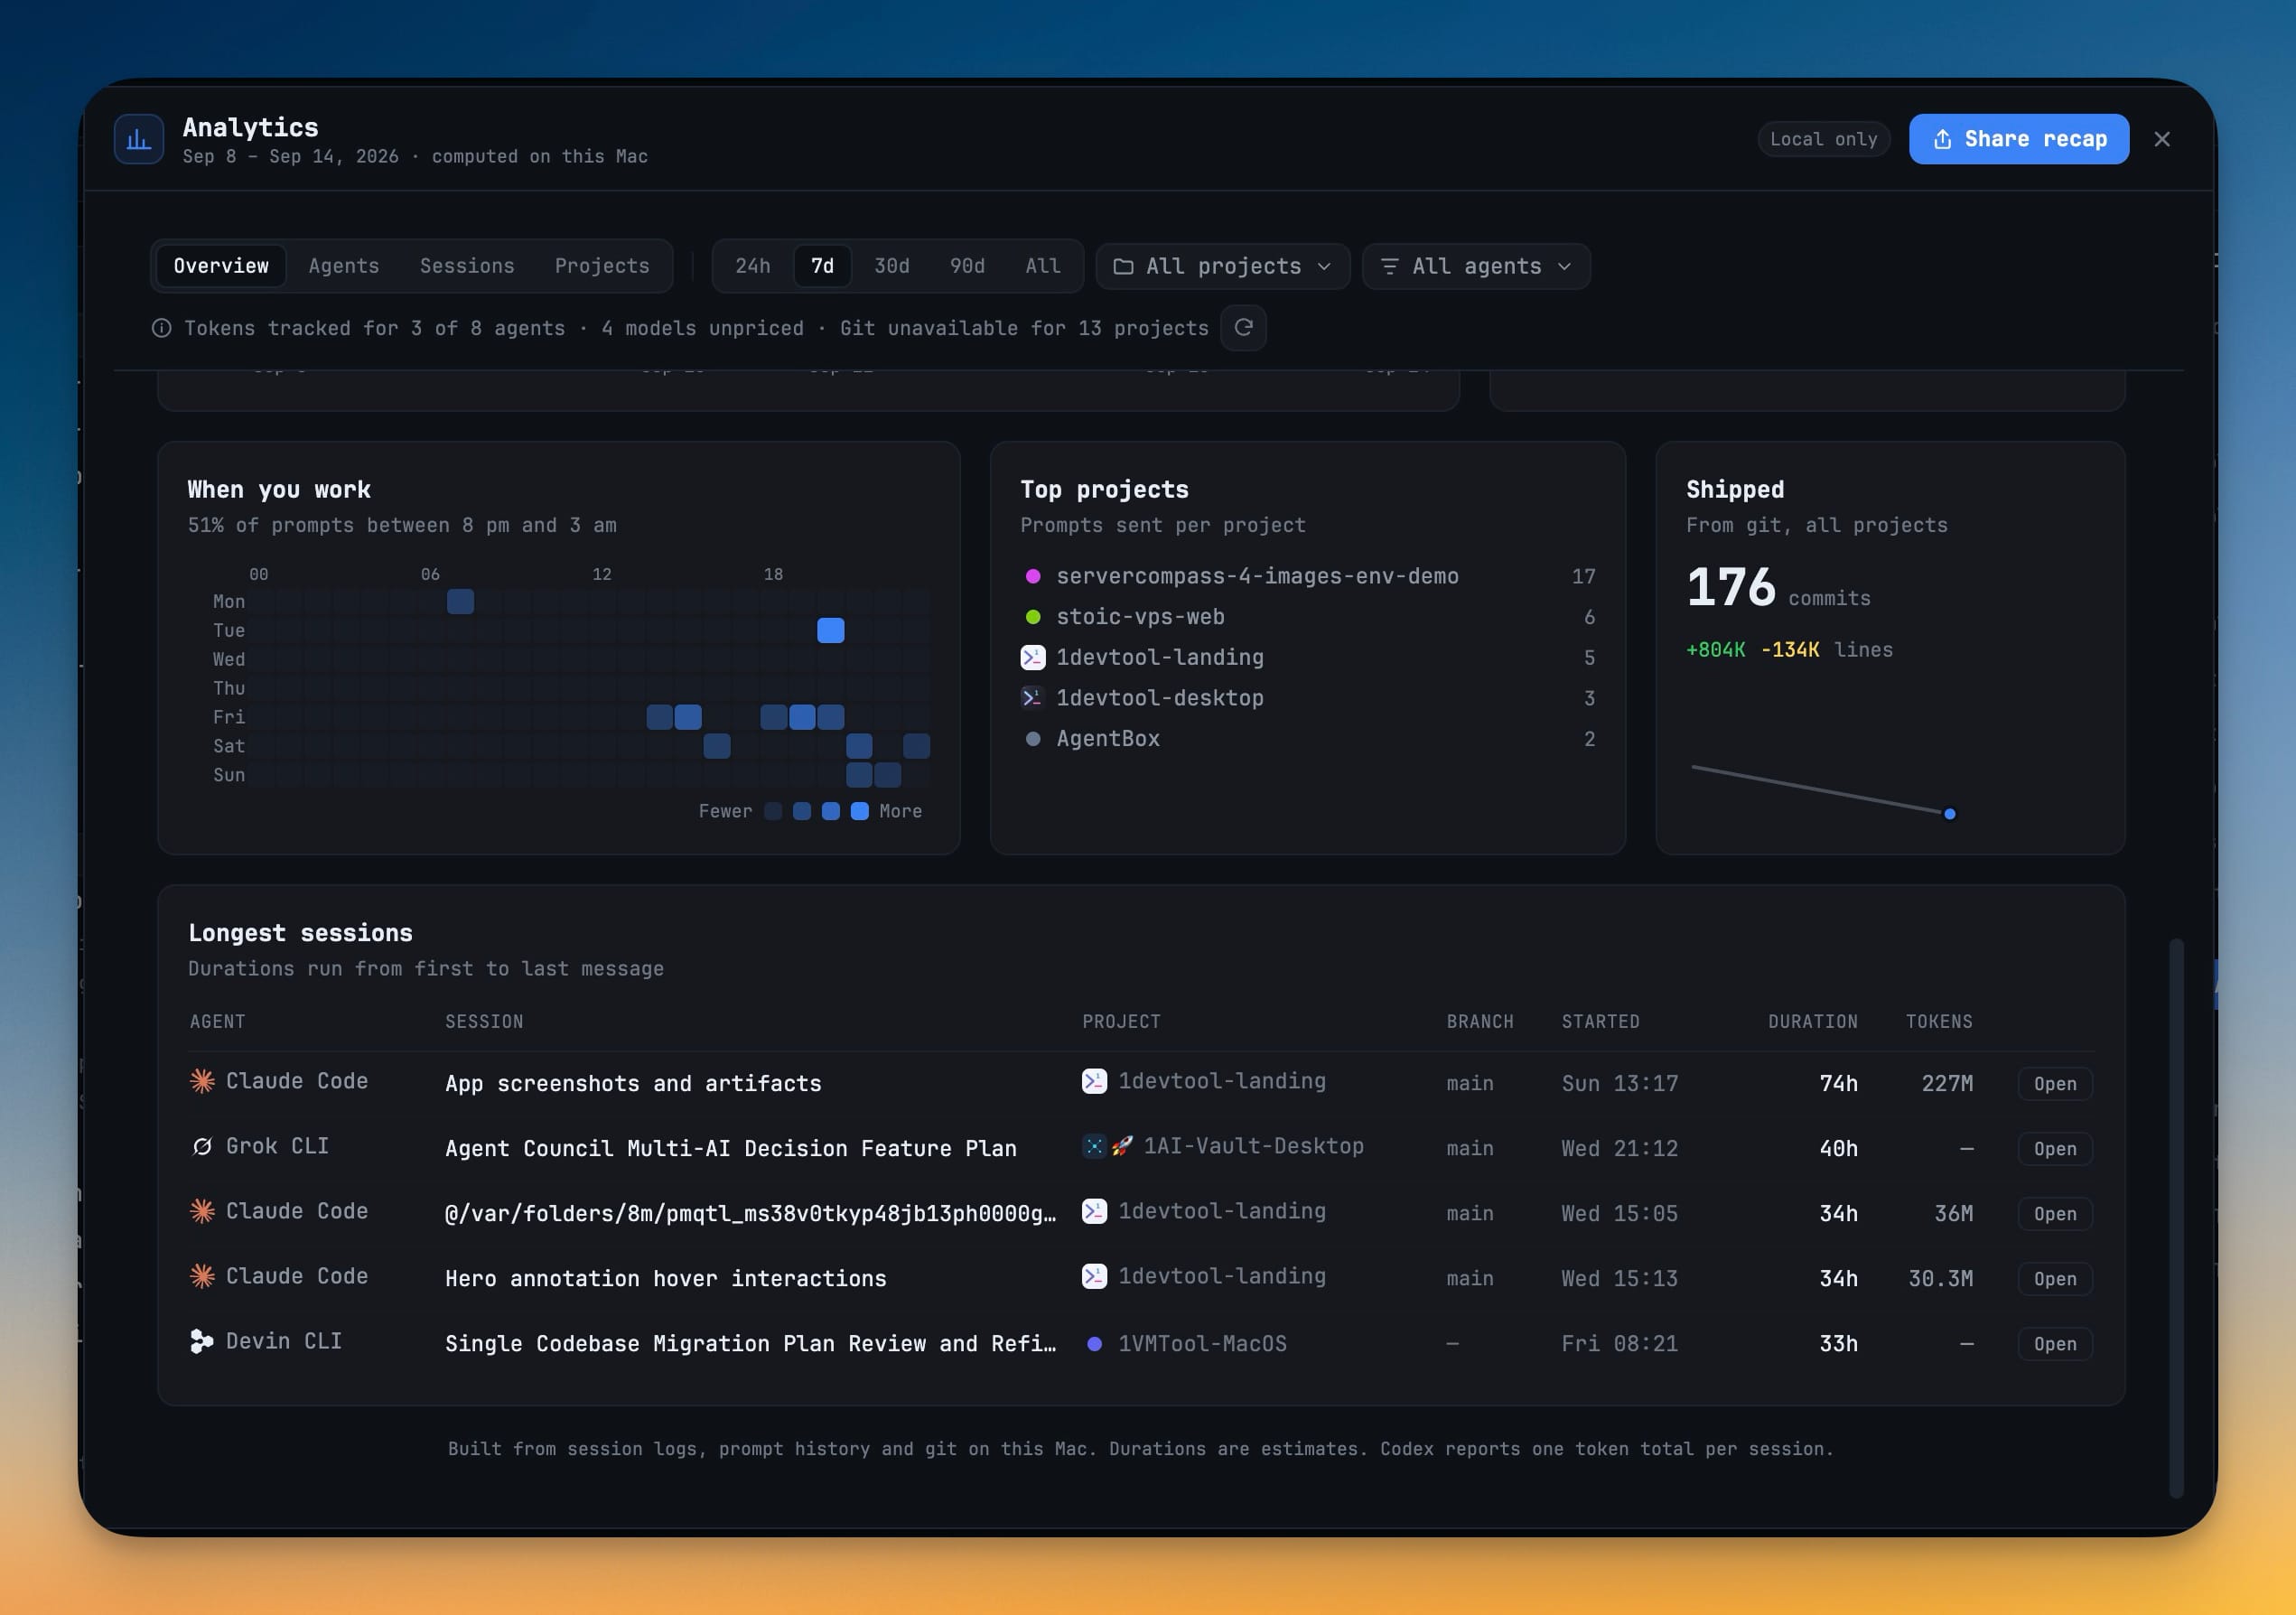
Scope any of it with the range chips — 24h, 7d, 30d, 90d or All — and narrow it to one project or one agent with the All projects and All agents pickers. Long ranges stay readable because the charts roll up from days to weeks to months instead of squeezing a hairline bar in for every day.
Find out where the tokens go
Agents lists every CLI you used in the period, each with its real brand mark, ordered by sessions. Pick one and you get its prompts, median session, tokens and cache hit rate, a tokens-per-day chart, a Where tokens go breakdown — cache read, cache write, output and input — and a Models list of what you actually ran.
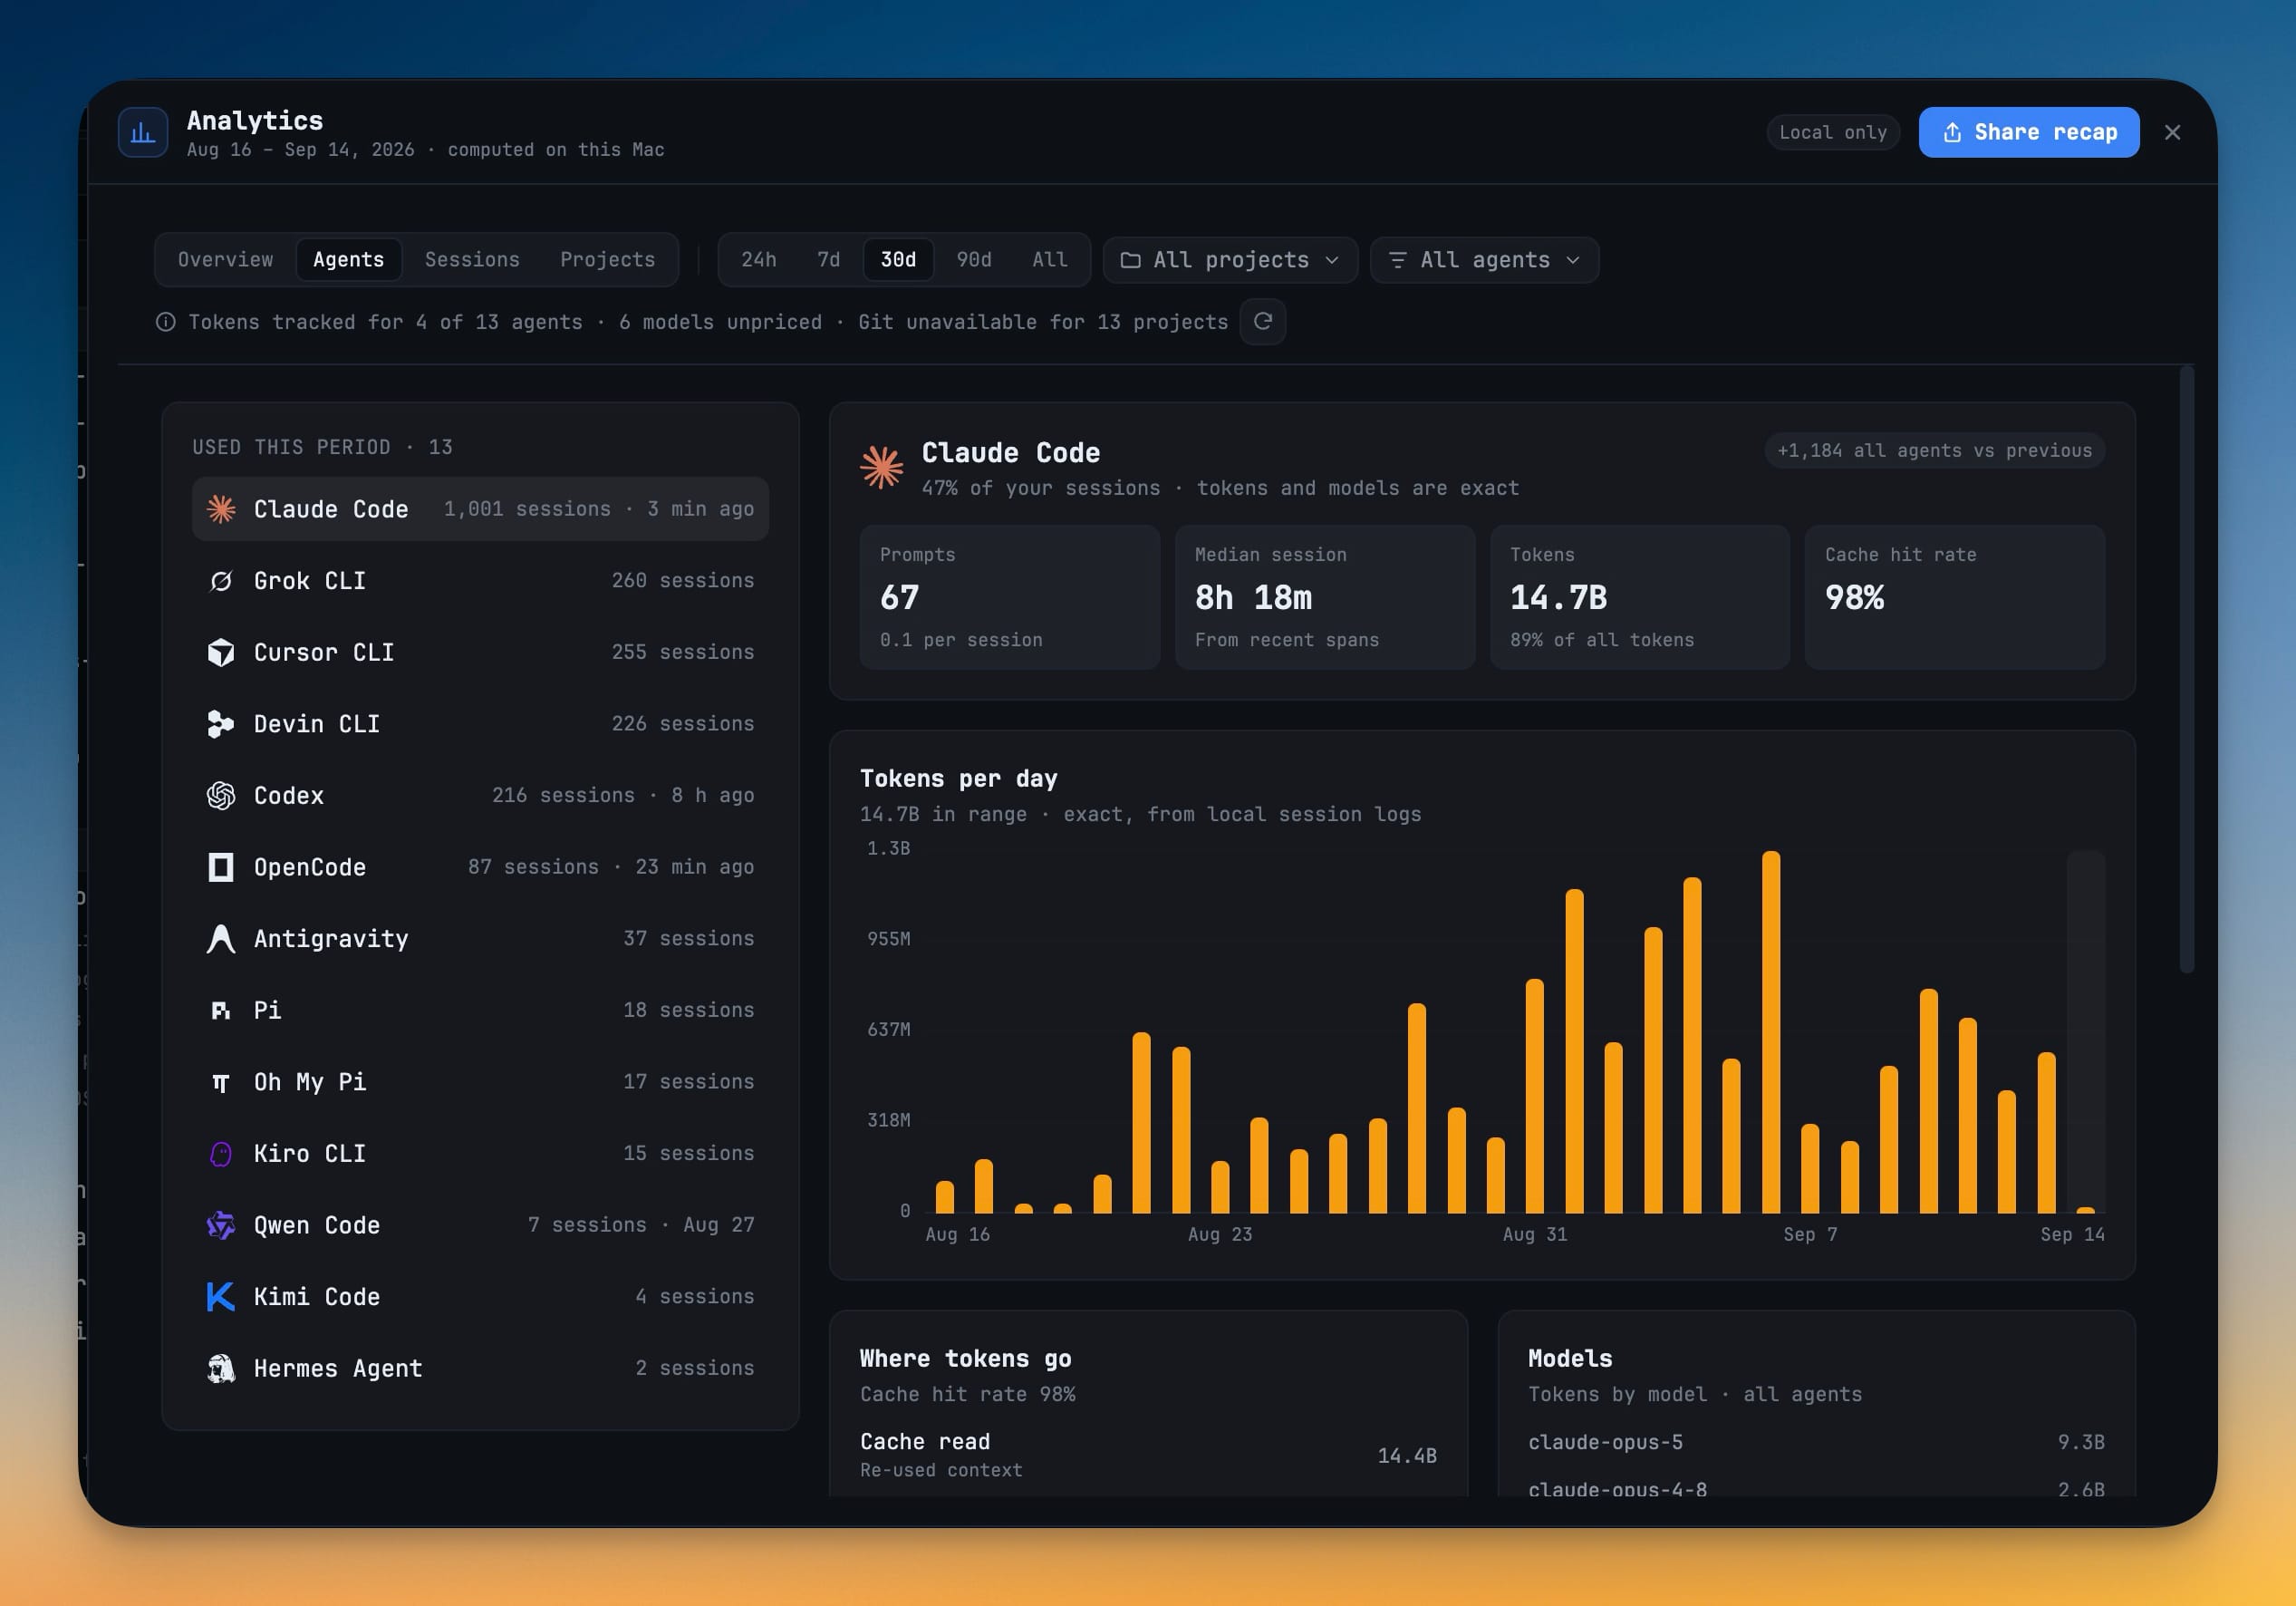
The Models list is where the surprises live. If nearly all of your tokens are cache reads, your long context is doing its job. If a model you thought you had moved off still carries a third of the volume, now you know. A model with no known list price gets a warning rather than quietly counting as free.
See how your sessions really overlapped
Sessions lays the week out as a timeline — one bar per session, from first to last activity — with a Parallel agents chart for how many ran side by side, a Session length histogram, and your orchestration runs split into passed and failed. Select a session to see its project, branch, model, span, tokens and first prompt, then Copy resume command to pick it back up in a terminal.
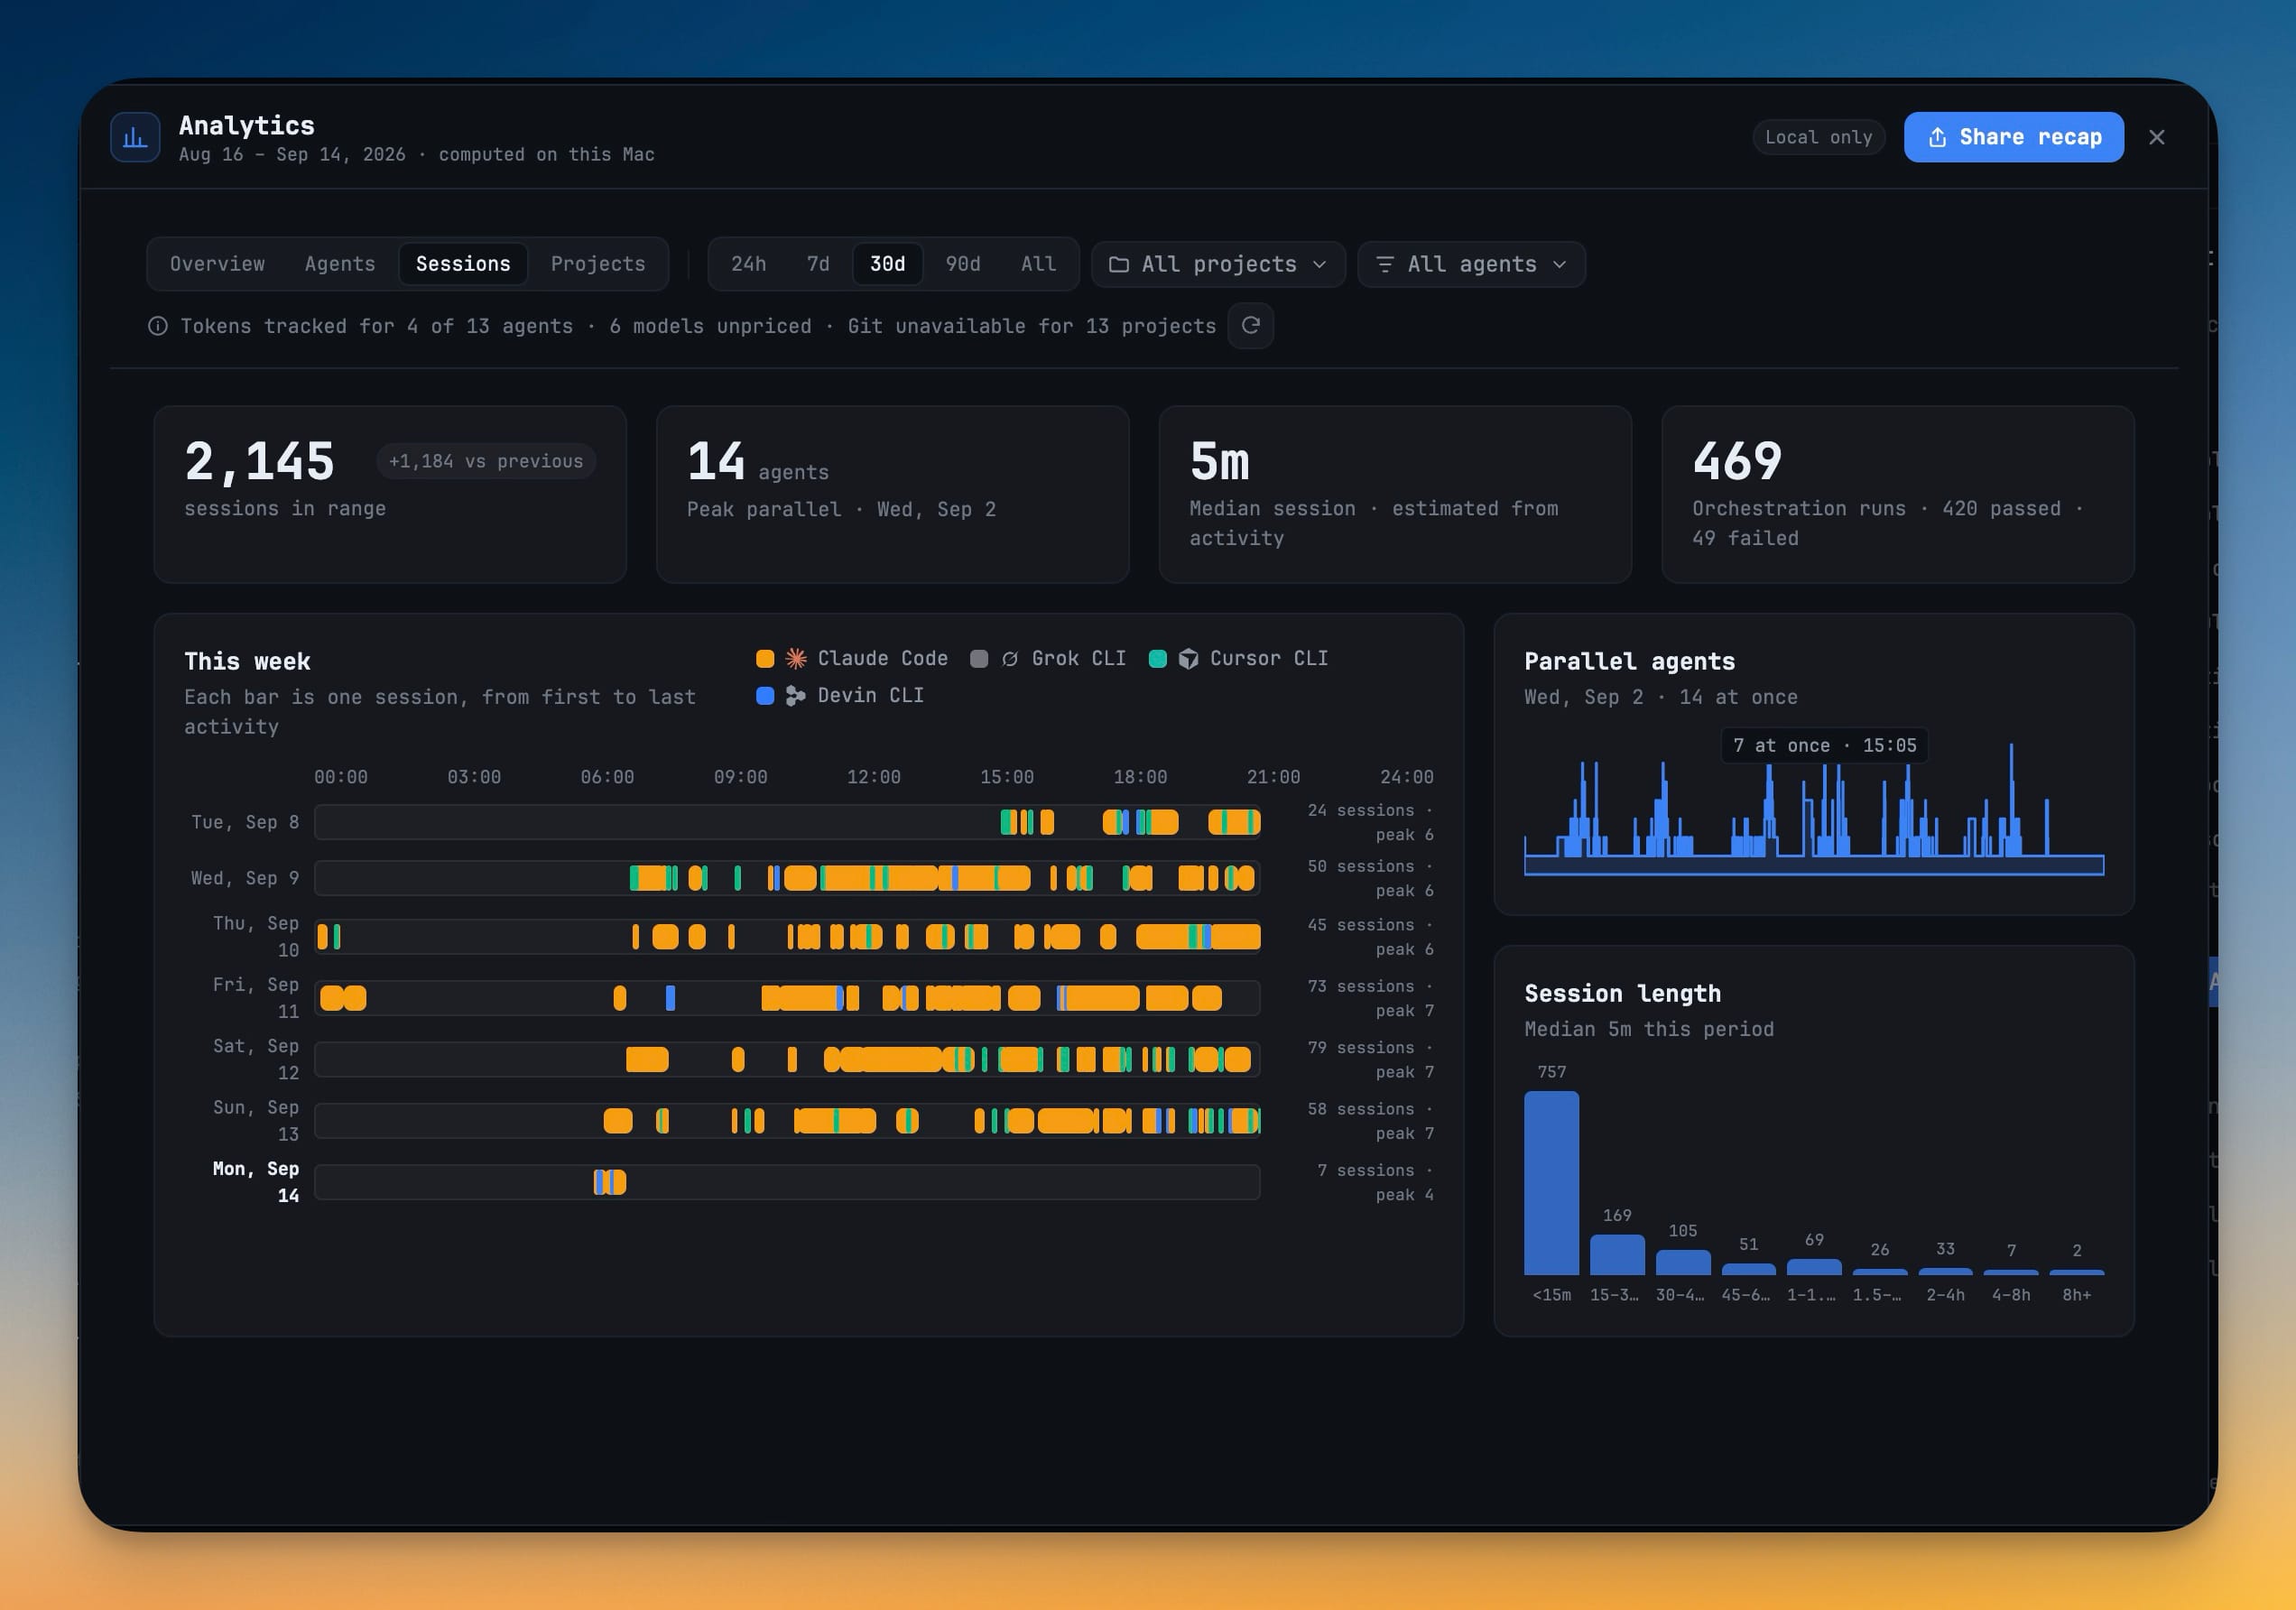
Projects turns it around: every project you touched in the range, with its prompts, sessions, commits and lines changed side by side, and a plain marker where a source such as git doesn't cover that project.
Honest numbers, or no numbers
Analytics doesn't paper over what it can't see. Exact token counts come from the agents that write them to disk — Claude Code, Codex, Gemini, Qwen and OpenCode. When some of the agents you use don't, a coverage line says so in plain words: Tokens tracked for 3 of 8 agents · 4 models unpriced · Git unavailable for 13 projects. Missing data is left out instead of being drawn as a zero, and spend is labelled an estimate everywhere it appears.
It is also cheap to open. The dialog paints the last computed snapshot straight away and refreshes behind it, and it computes nothing at all while it is closed.
Turn a week into a card
Share recap turns a Week, Month or Year into an image. Pick Poster (1200 × 630), Archetype (1080 × 1350 — your coding archetype, once a period has enough activity to earn one) or Receipt (720 × 1280), then Copy image, Save PNG… or Copy text.
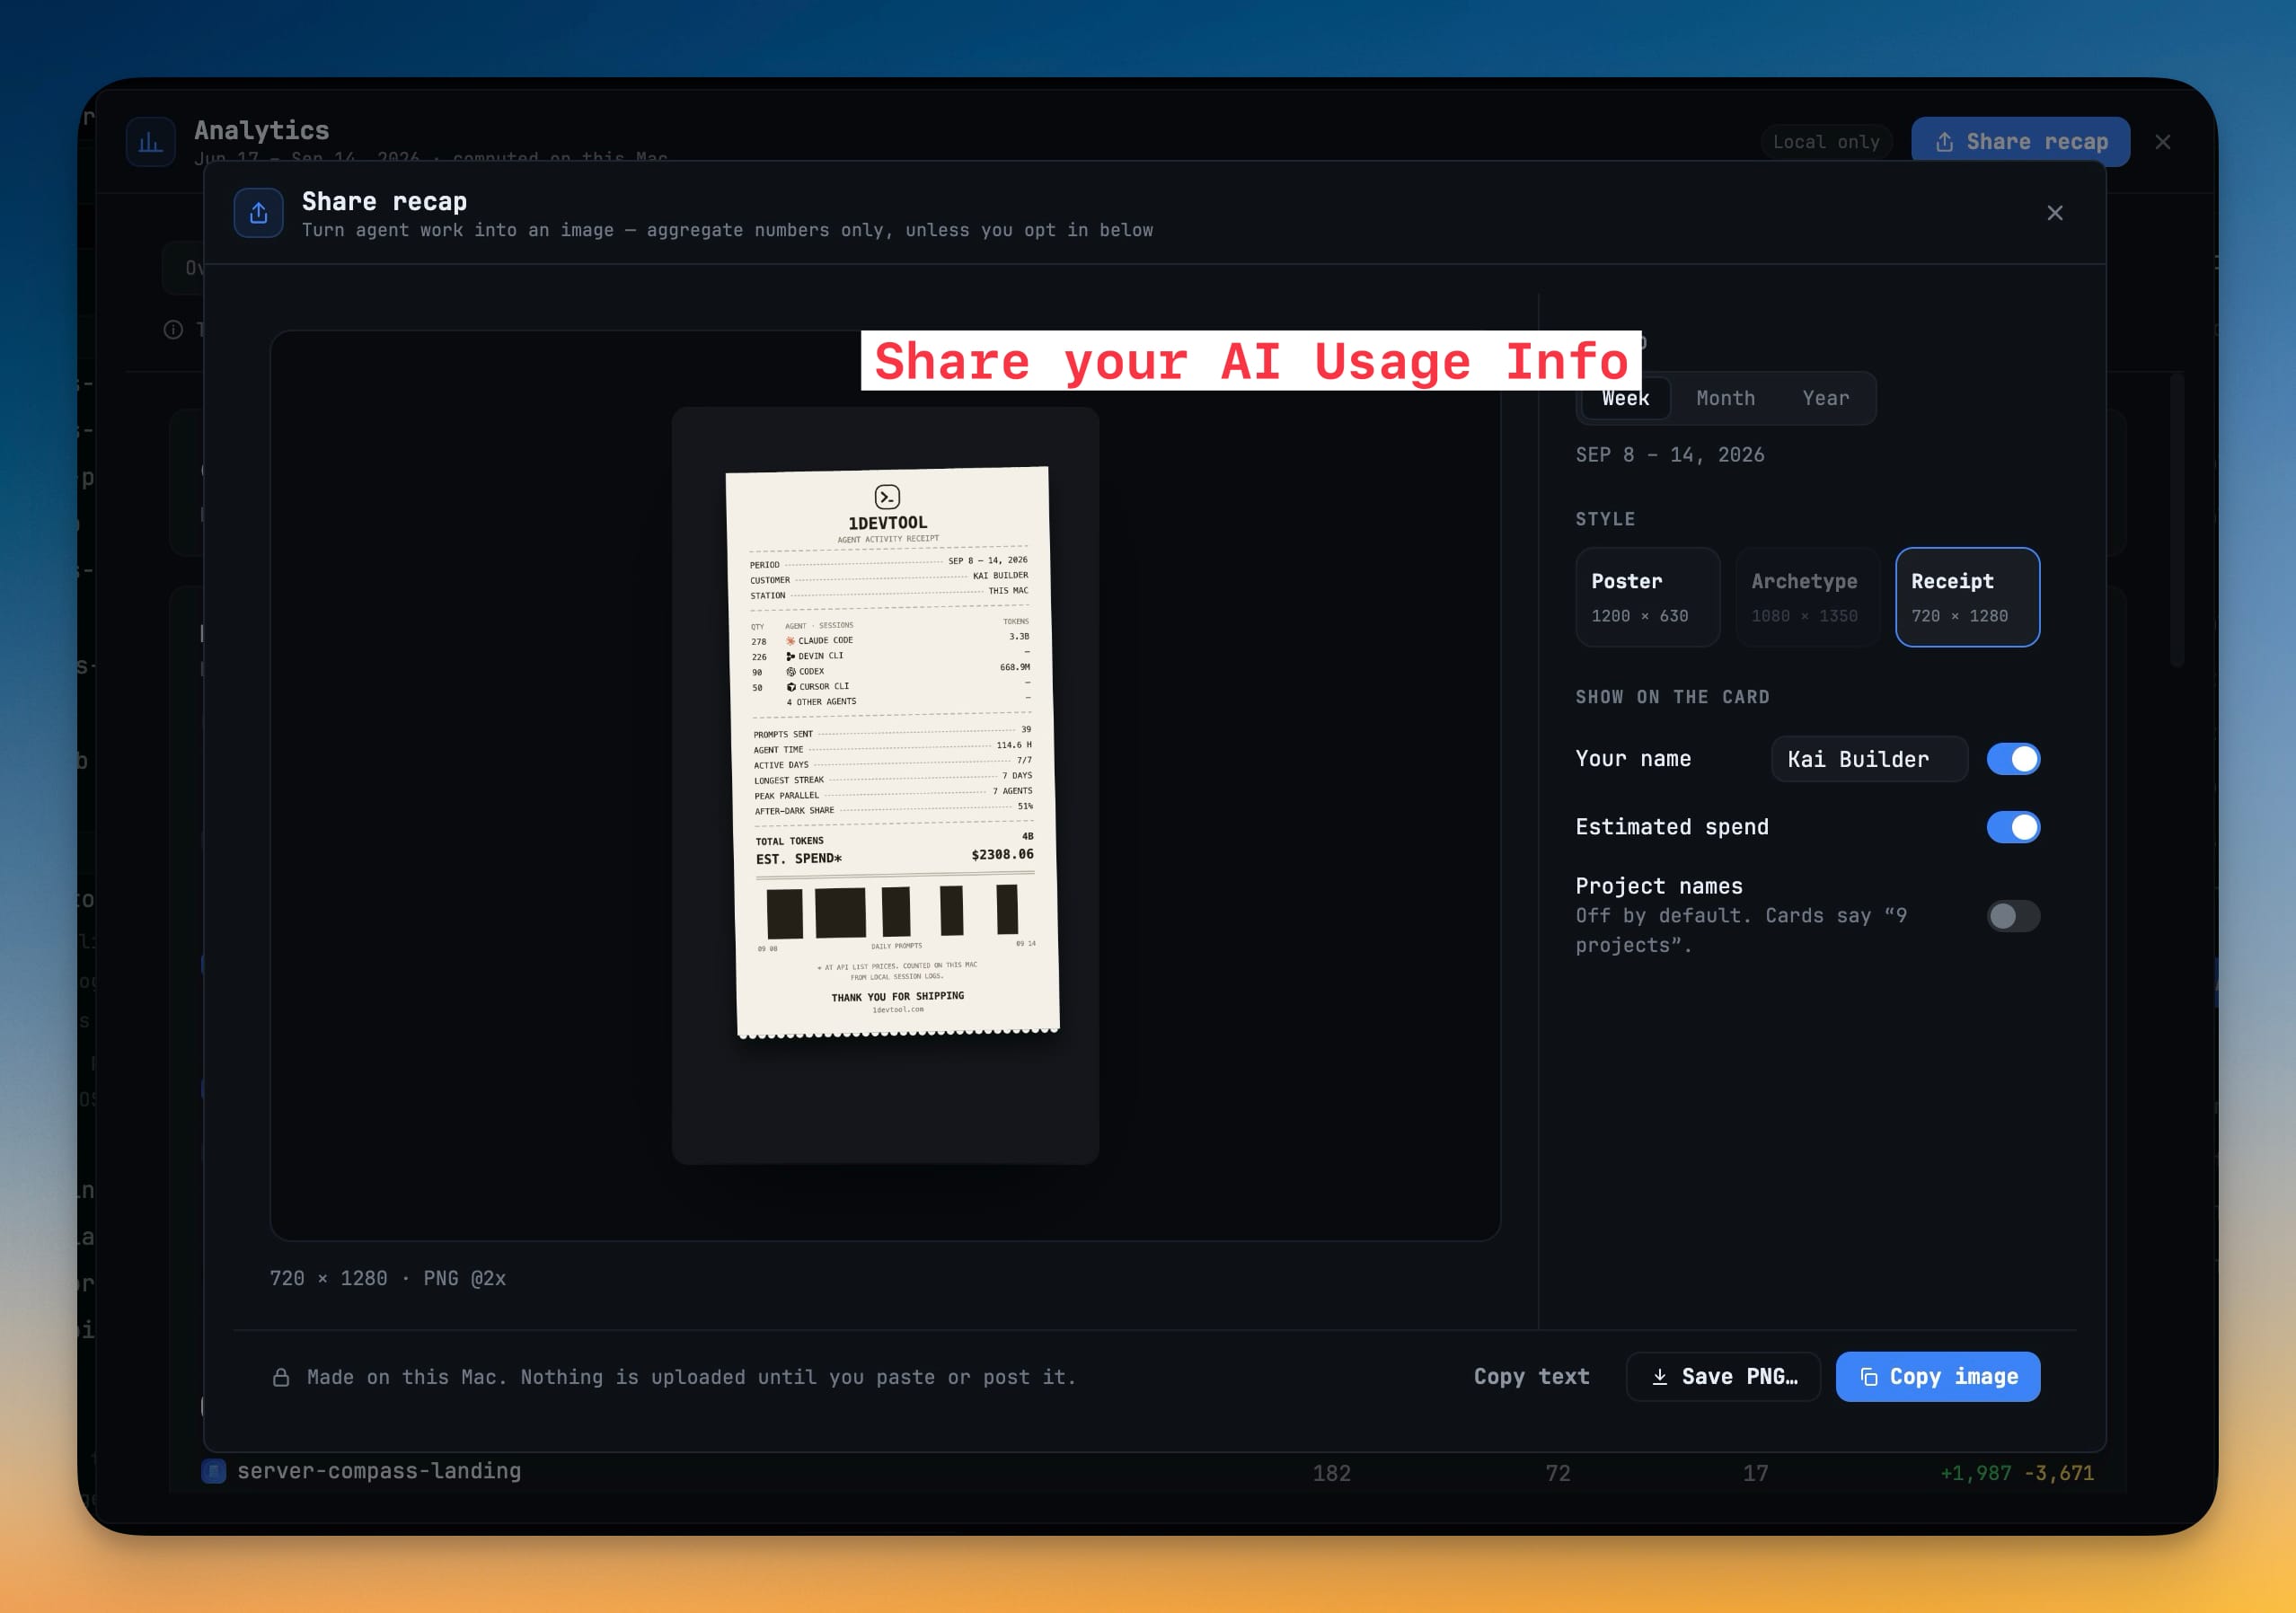
Cards carry aggregate numbers. Your name and estimated spend are toggles, and Project names is off by default, so a card says "9 projects", not which nine. Session titles and prompts never go on a card at all. The footer puts it plainly: Made on this Mac. Nothing is uploaded until you paste or post it.
Set your defaults once in Settings → Analytics: the range Analytics opens on, the card style and period a new recap starts with, what a card shows, and Reset cache to clear the computed sections without touching your agent logs, prompt history or git. The top-bar Analytics button is off by default — switch it on under Settings → Layout if you want it one click away.
Also in 1.74.0: team setup you can watch, and a real prompt queue
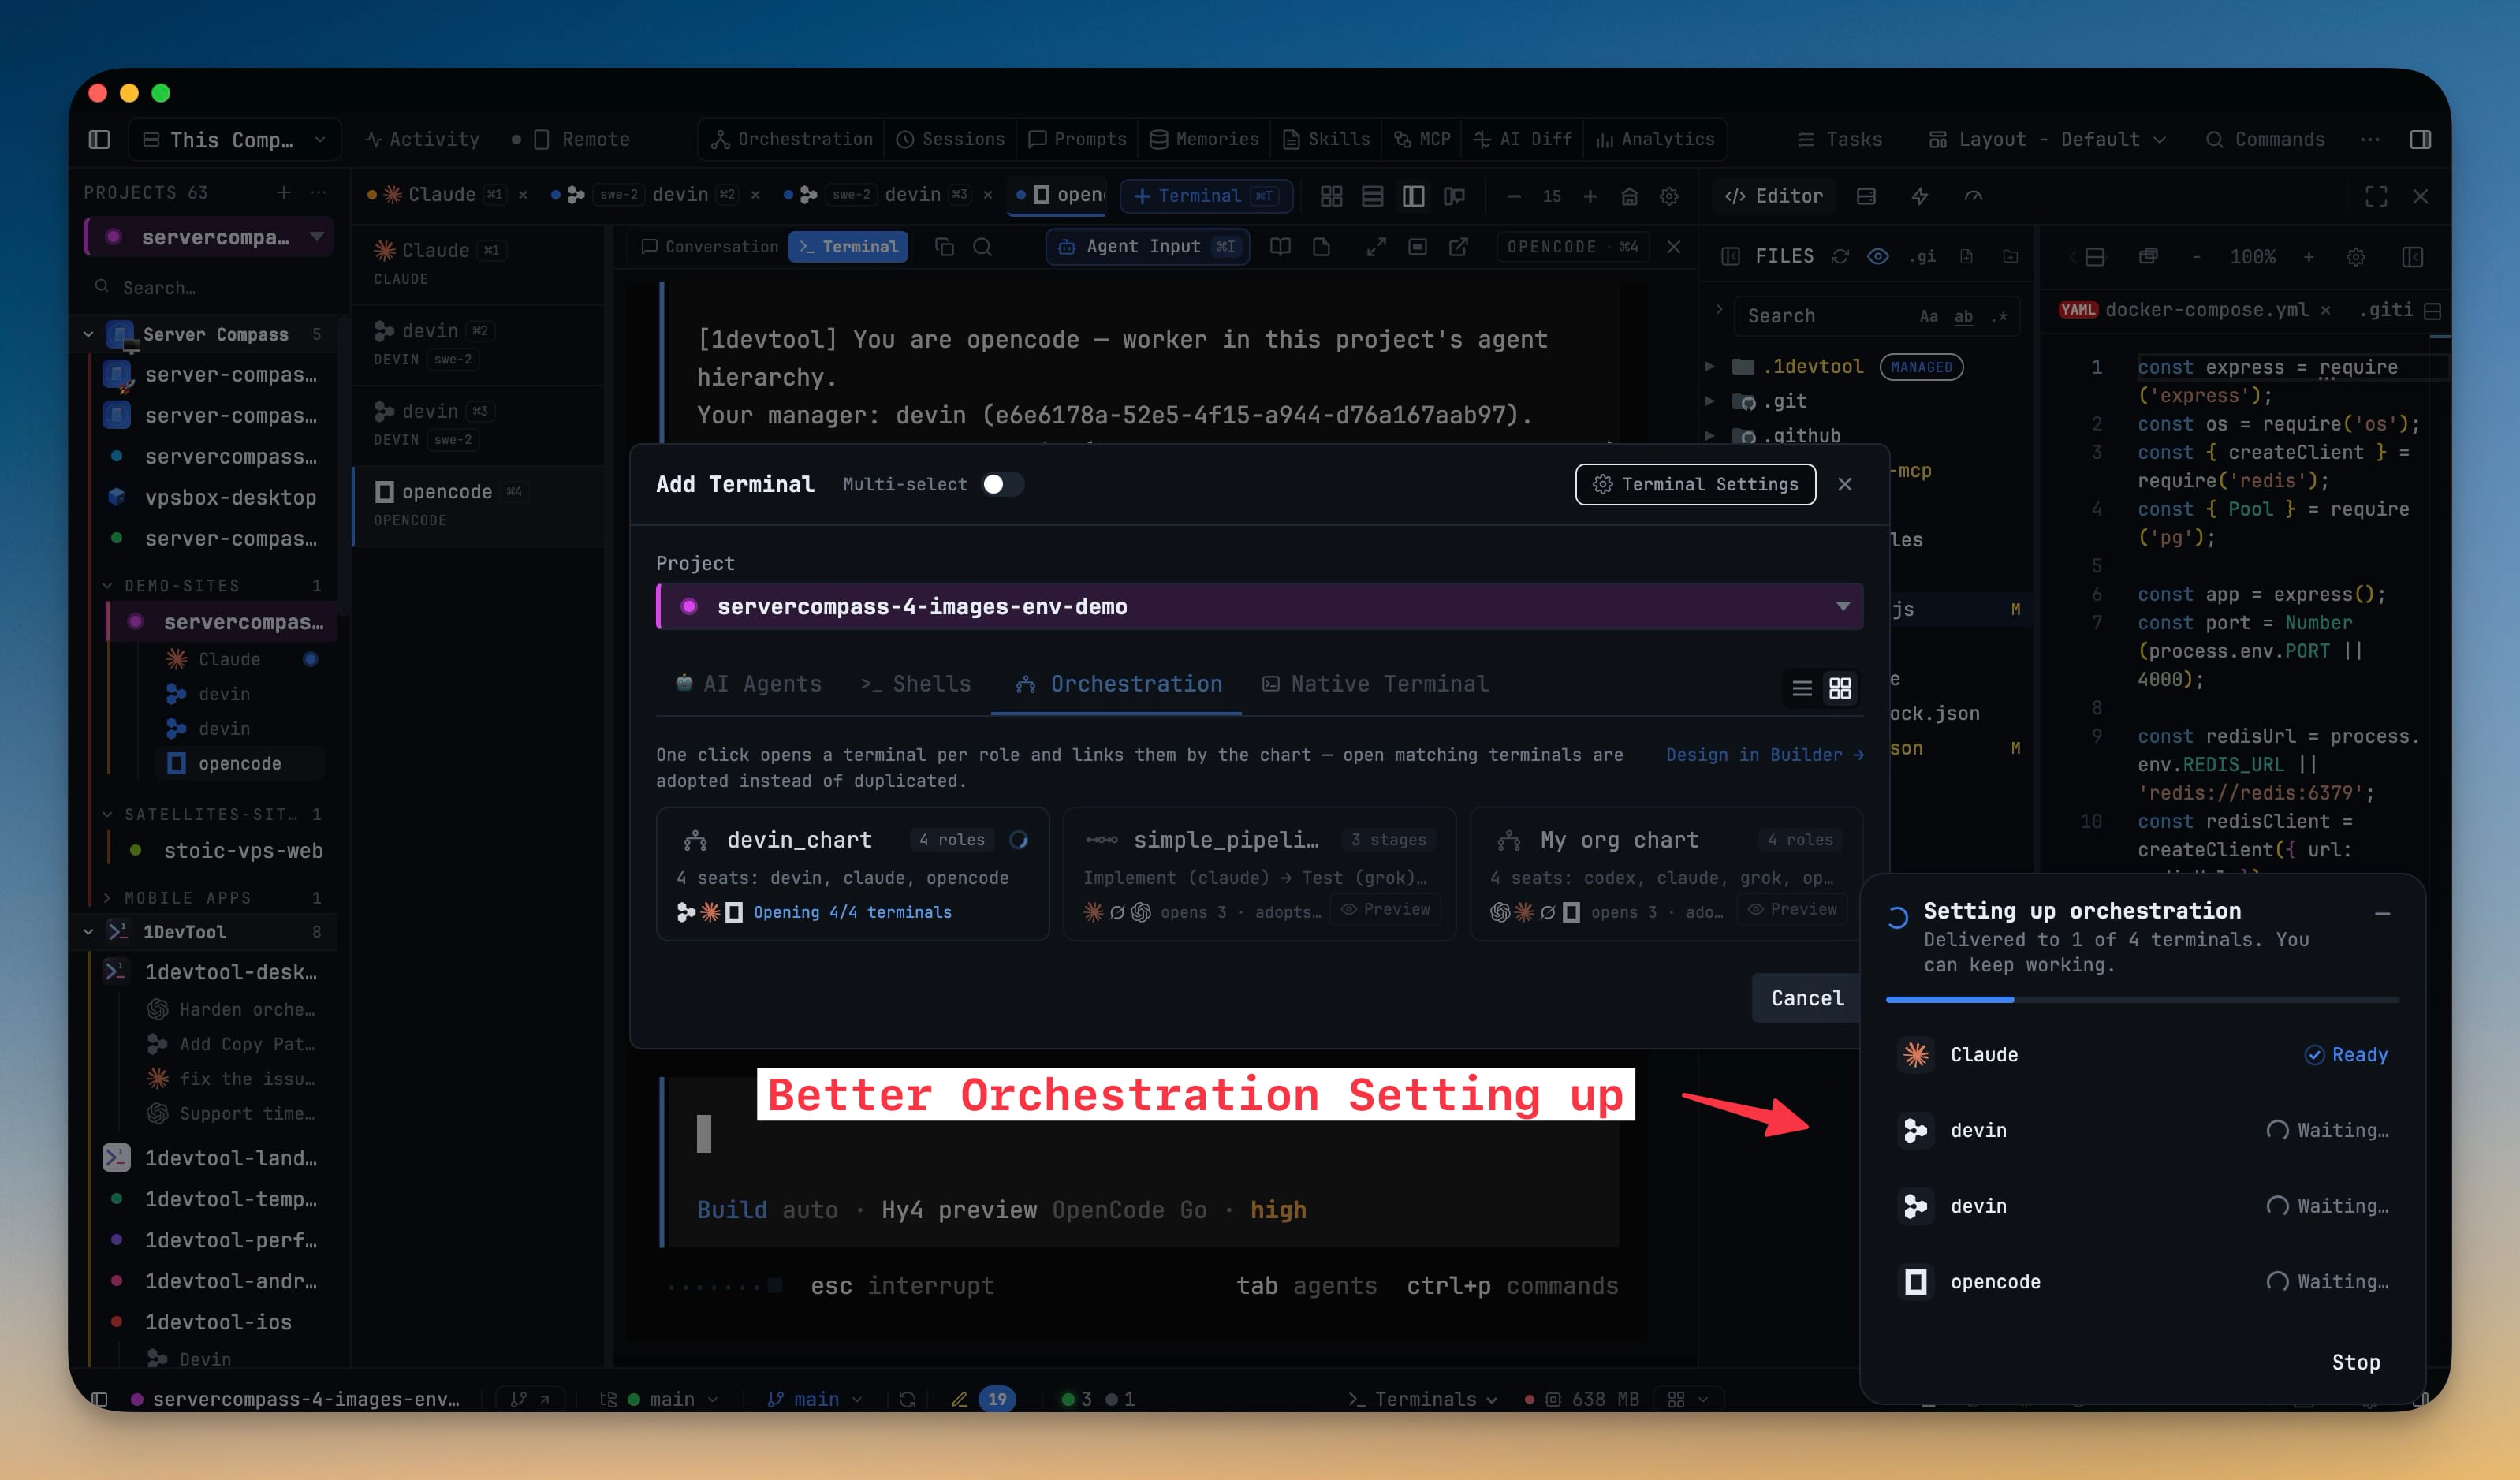
Starting a team no longer freezes you out of the window. A floating Setting up orchestration card counts delivery down — Delivered to 1 of 4 terminals. You can keep working. — with each seat marked Waiting…, Sent, Ready or Needs you, and it collapses to a small pill when you want it out of the way. A seat that missed its instructions becomes a manual step with Copy, Open terminal and Send to Terminal, instead of a team that quietly starts one agent short.
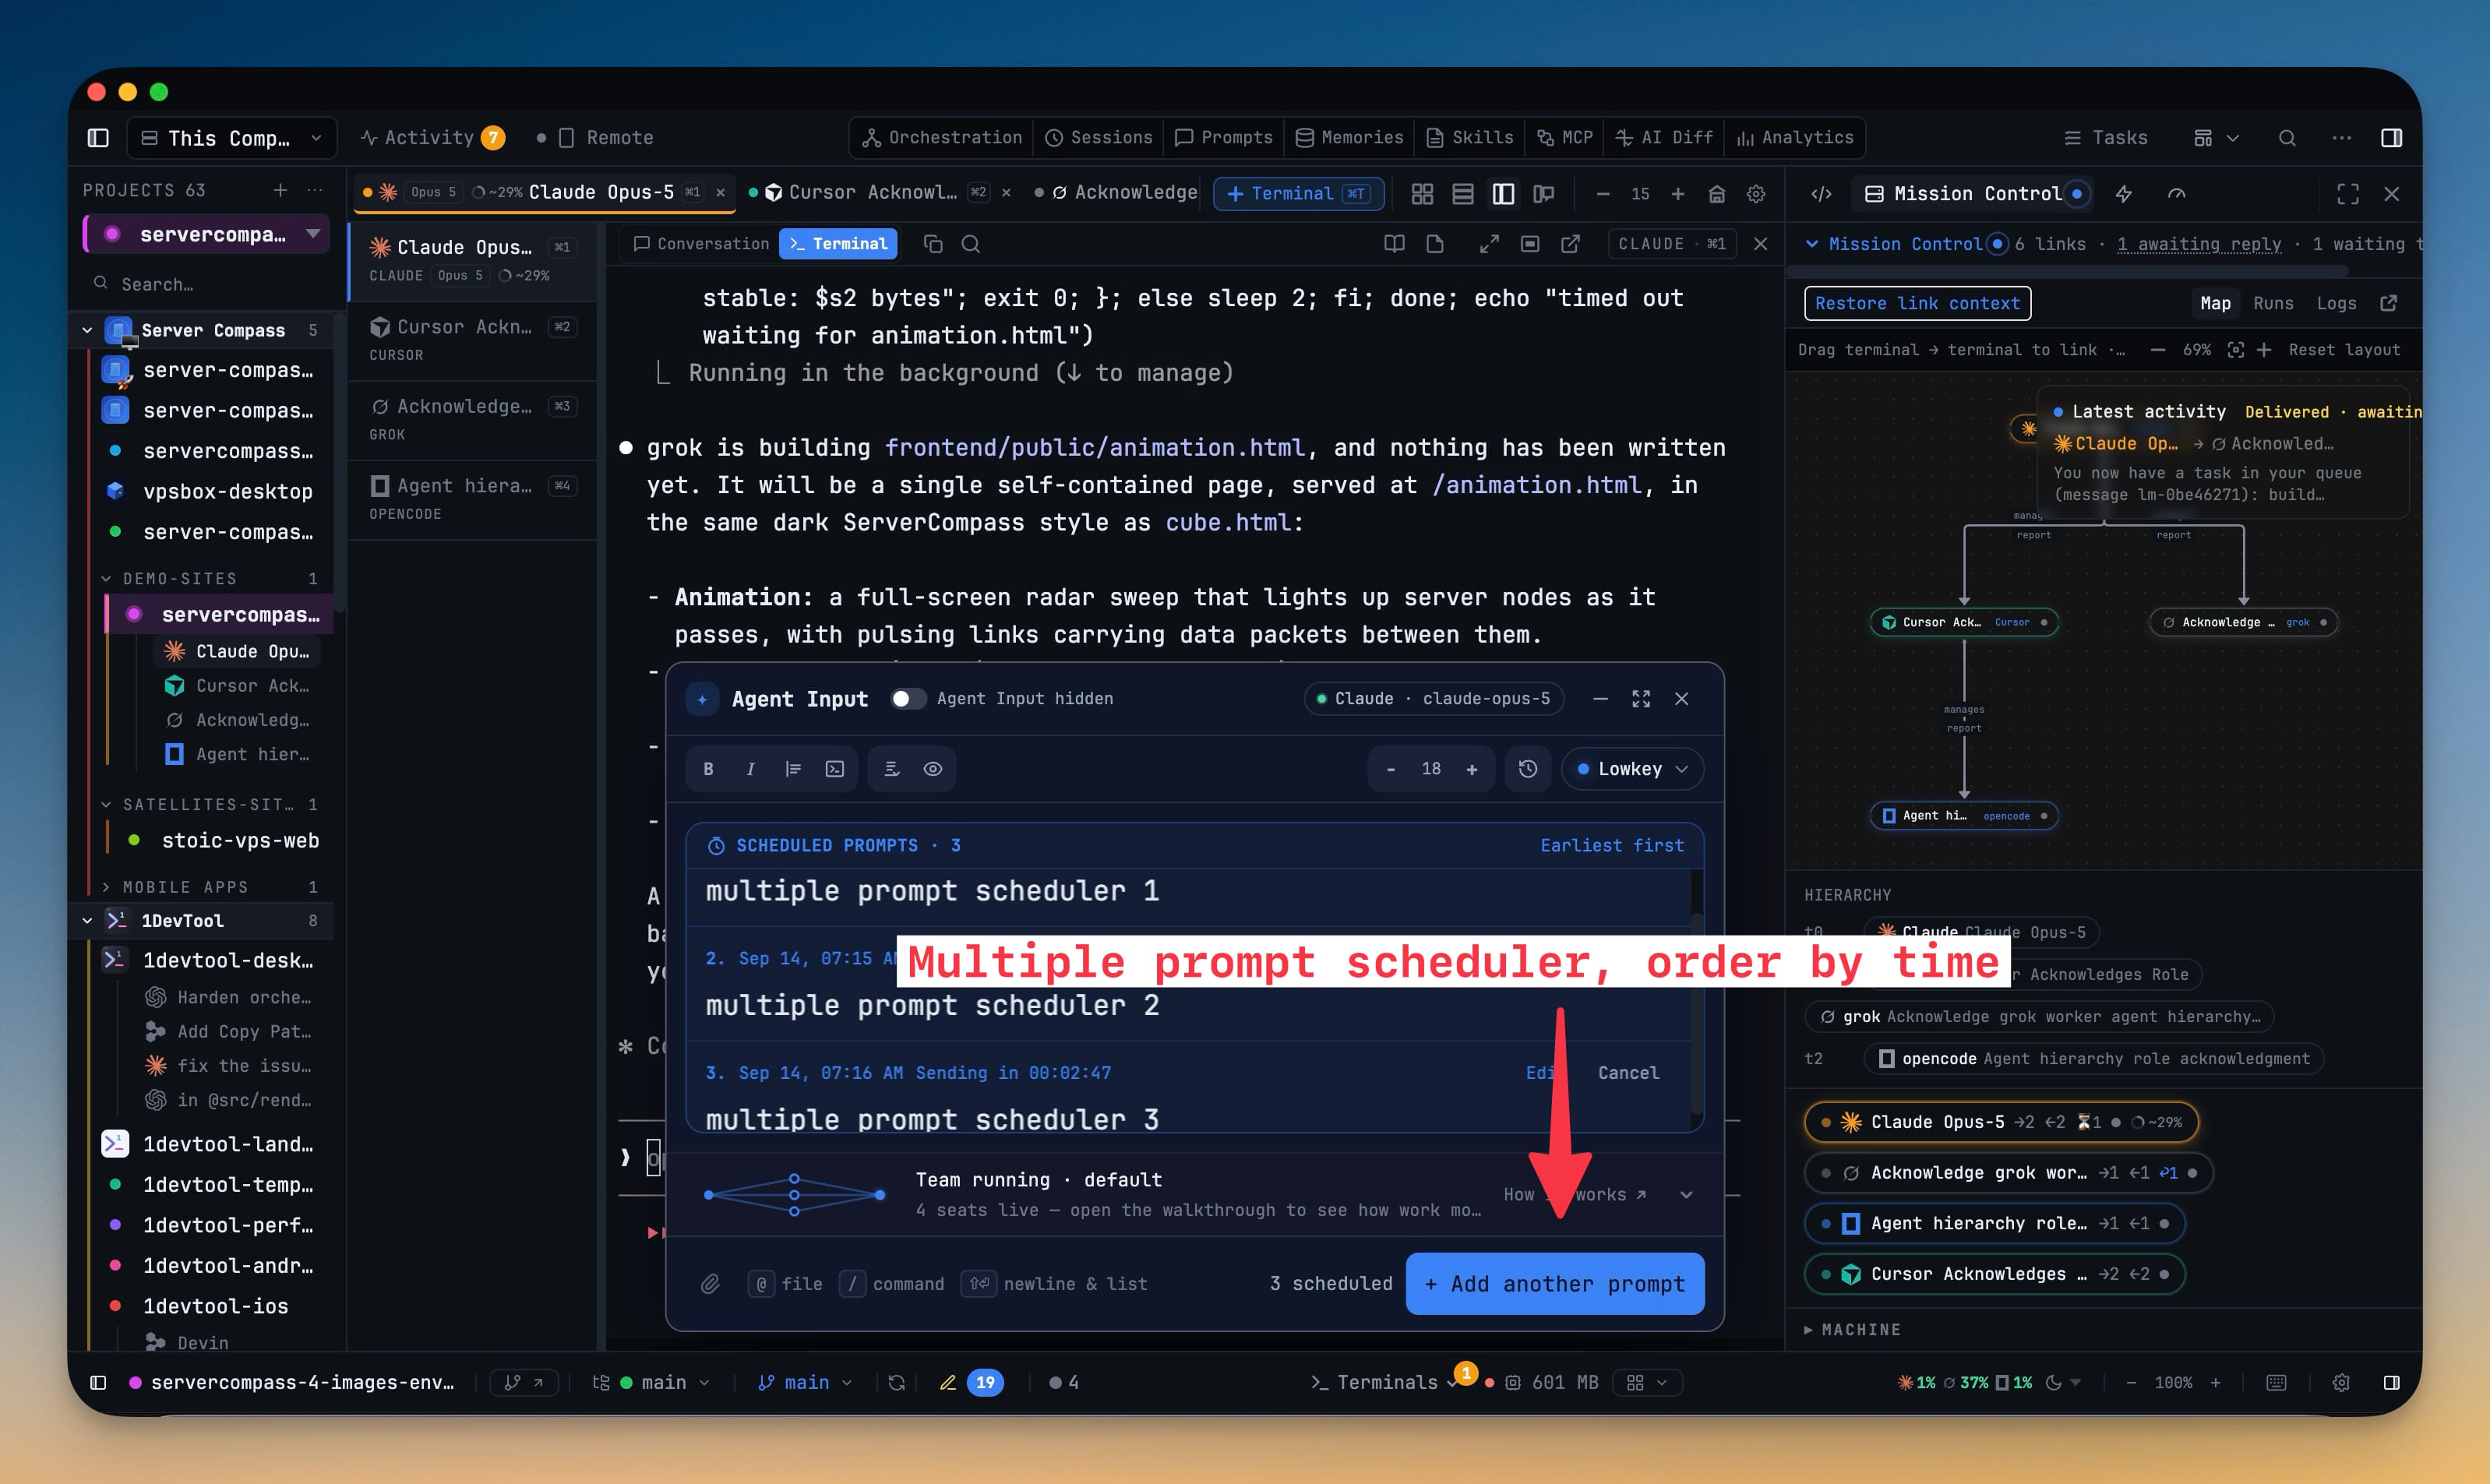
Scheduled prompts stack now, too. Schedule a second or third prompt for the same terminal and Agent Input shows Scheduled prompts · 3, earliest first, each with its send time, Edit and Cancel. If a send fails, that terminal's queue pauses until you restore or remove the failed prompt, so nothing fires into a half-written composer, and prompts that came due while your machine was asleep go out one at a time.
Remote pairing got stricter as well: a newly paired phone connects as a read-only Viewer until you grant it more under Settings → Remote, a QR invite works once and expires after ten minutes, and browser pairings expire at most seven days after pairing, however often you use them.
Before vs After
| Question | Before | With Analytics |
|---|---|---|
| How much did my agents do this week? | Guess from memory, or dig through each CLI's logs | Overview: sessions, prompts, agent time, tokens and spend in one view |
| Which agent burns the tokens? | Parse a different JSONL format per tool | Agents: tokens per day, cache split and models for each CLI |
| Did my agents really run in parallel? | No way to tell | Sessions timeline plus the Parallel agents chart |
| What did the week cost? | Wait for the monthly invoice | Estimated spend at API list prices, with unpriced models flagged |
| Share how you work with agents | Screenshot a terminal and crop out project names | A Share recap card with aggregate numbers only |
Who benefits most
- People who run several CLIs at once. If you split work across Claude Code, Codex, Cursor and Devin, the Agent mix and Parallel agents charts show whether that split is real or aspirational.
- Anyone paying per token. Estimated spend and the Where tokens go breakdown tell you what the week cost and why — before the invoice does.
- Builders who share their process. A Poster or Receipt card is a week of agent work in one image, without leaking a single project name unless you decide it should.
Try it
Update to 1DevTool 1.74.0, press ⌘⇧A, and look back at your last seven days. Everything is built from what is already on your machine, so there is nothing to connect and nothing leaves it — you simply get to see the work you did.