Sep 5, 2026
Which Terminal Is Eating Your Machine — Now You Can Actually Tell
The Resource Manager now splits CPU and memory into three buckets that add up to what your OS reports — 1DevTool, your terminals, and everything else — with a strip that names the pane to deal with. Plus agent hibernation, idle tab unloading, and an install less than half the size.
The fans come on. Your laptop gets warm enough to notice. You open Activity Monitor, and there it is: 1DevTool, several gigabytes, near the top of the list. So the workspace is the problem, obviously.
Except it isn't, and you have no way to prove that. Six agents are running in six panes — Claude on a refactor, Codex chewing through a test suite, a build watcher you started three hours ago and forgot about. Every one of those is a process your operating system files under 1DevTool, because 1DevTool is what started them. Task Manager nests the shells, the node processes and the claude binary under our row. Activity Monitor spreads the app across a handful of "Helper (Renderer)" rows and gives you no way to map any of them back to a tab. The number you are staring at is real, and it tells you nothing about which of your six panes to go and close.
That is the thing v1.71.0 fixes first, and then it spends the rest of the release making the number smaller.
What changed
The Resource Manager now splits CPU and memory into three buckets — 1DevTool itself, the terminals you started, and other apps on the machine — and the three add up to what your OS reports. Instead of one number you cannot act on, you get the split your OS refuses to make, and a way to jump straight to the pane that is causing it.
How it works in practice
You find out the workspace was not the problem
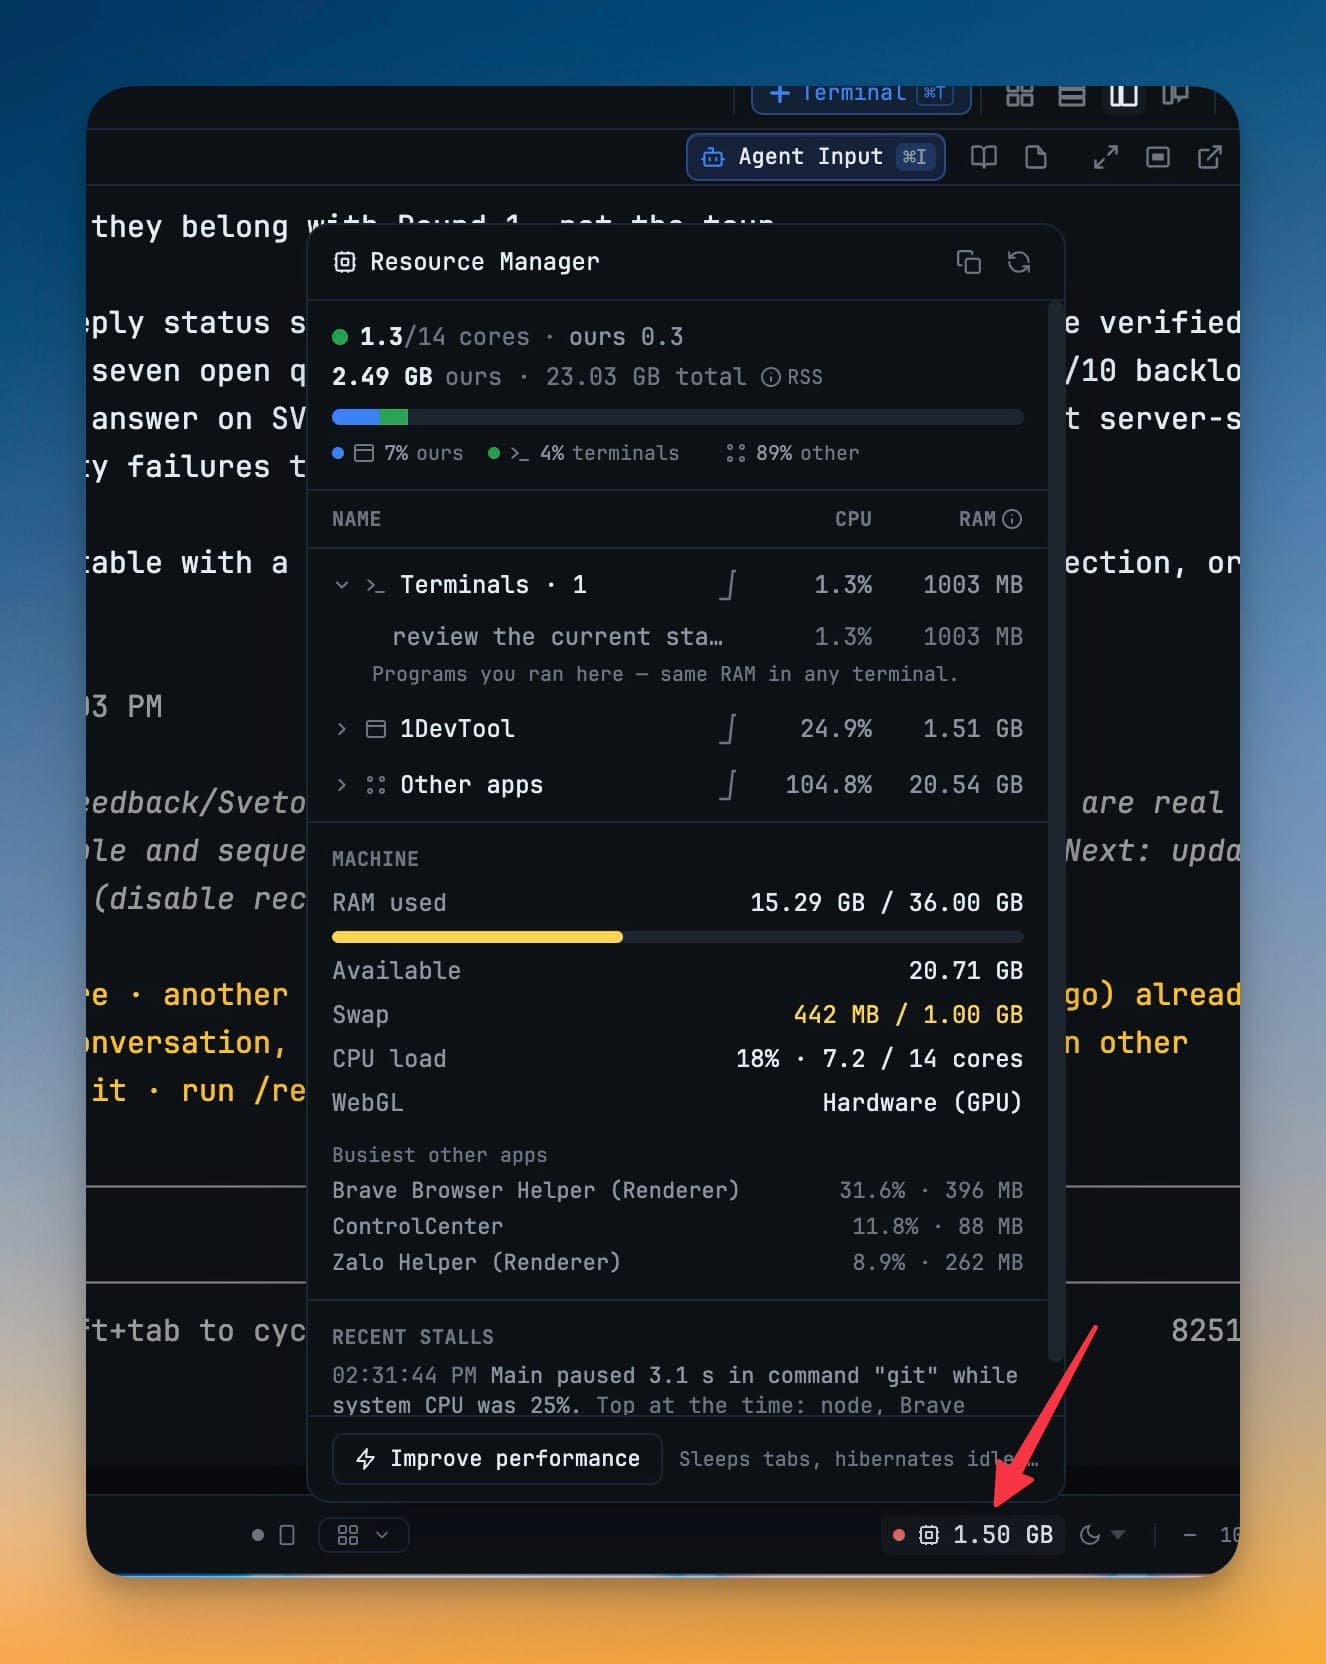
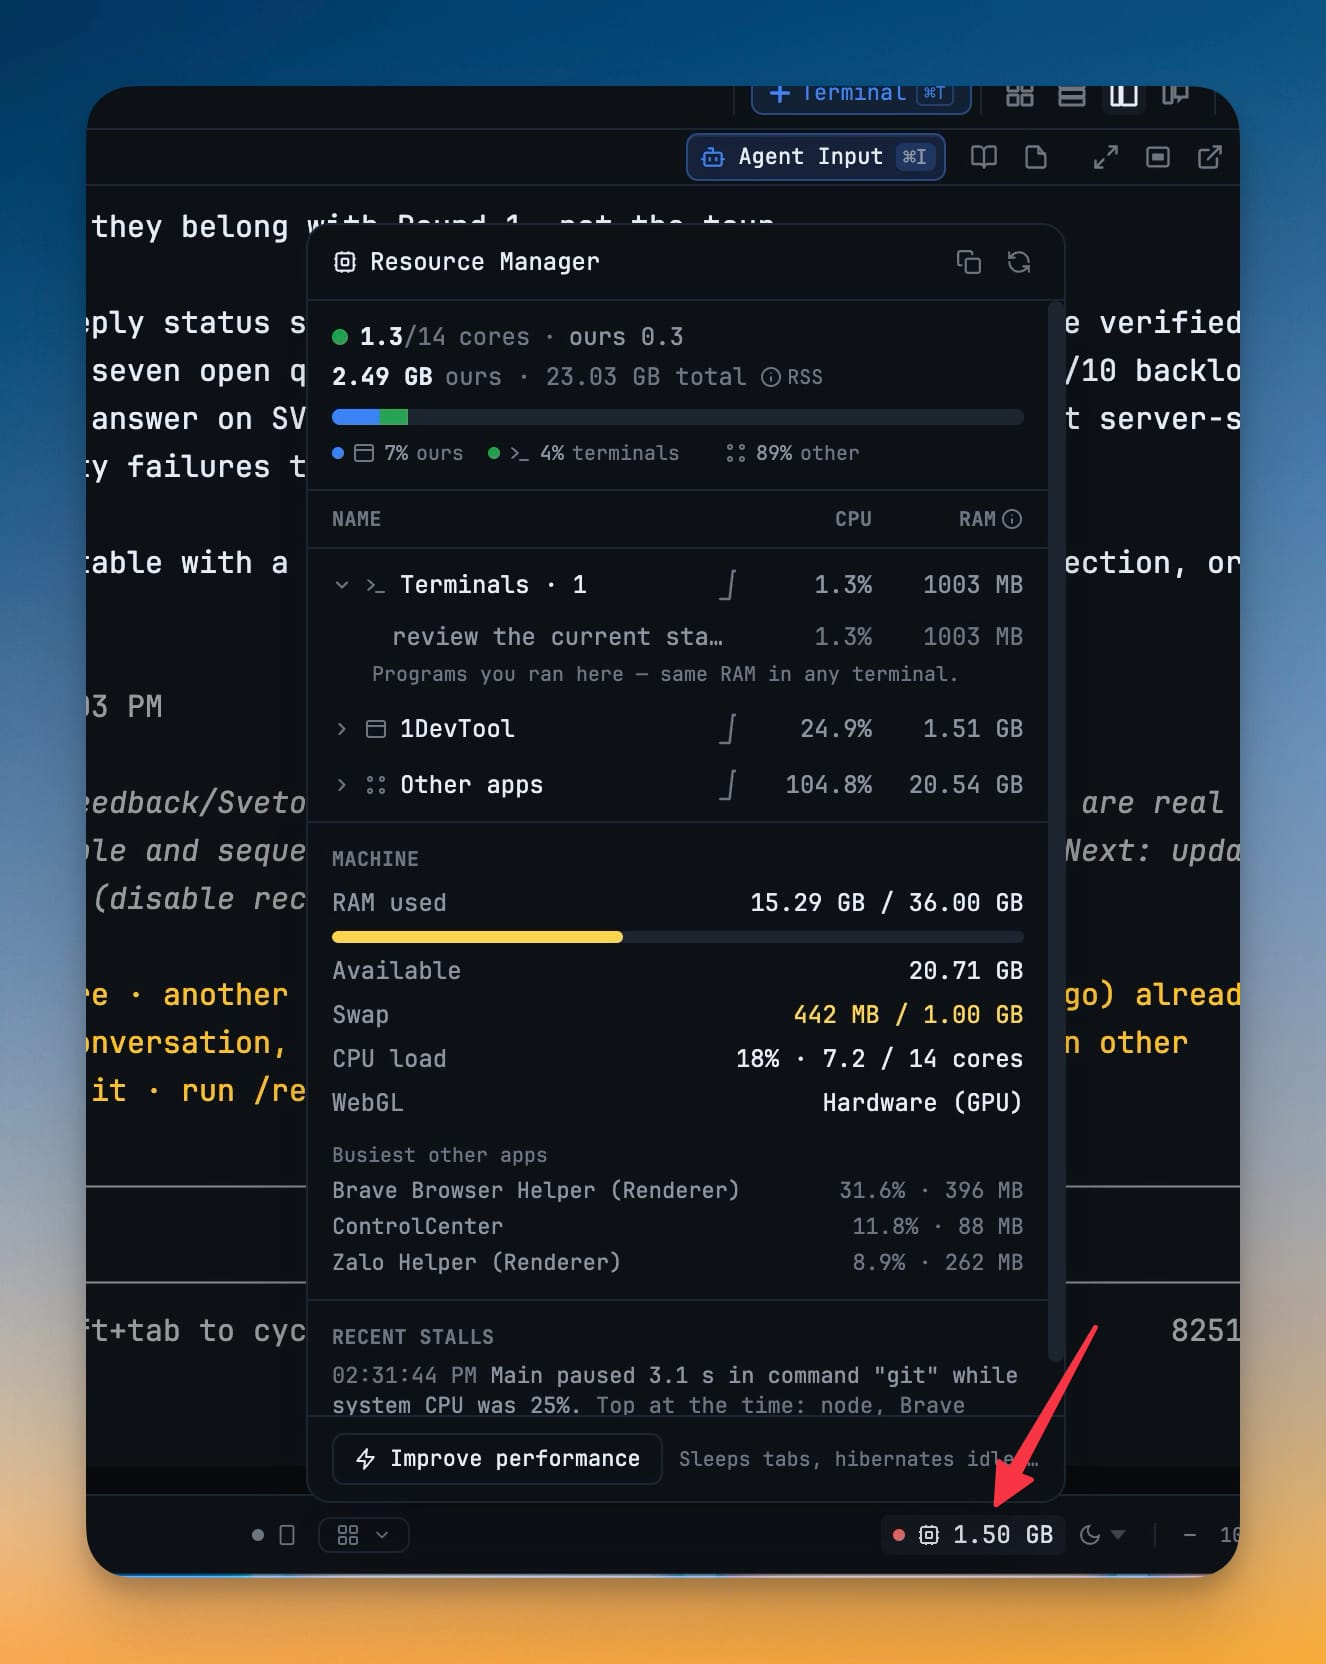
Click the memory reading in the status bar and the panel opens on a summary: cores in use against the cores you have, resident memory that is ours against the machine total, and a bar splitting that memory three ways. In the run above, 1DevTool and its terminals account for 11% of what is resident; the other 89% belongs to a browser, a menu-bar app and a chat client.
Each bucket carries a line explaining what it actually contains, so the accounting is not something you have to take on faith. The terminals row reads "Programs you ran here — same RAM in any terminal. Task Manager nests them under 1DevTool." That is the sentence that ends the argument: those processes cost the same in iTerm, and your OS was attributing them to us.
Expand a bucket and you get what is behind the number — each terminal named the way its tab is named, with its own CPU and RSS, so a runaway agent is a tab you can go and look at rather than an anonymous process id.
The strip tells you which pane, not which pid
When a pane pins the CPU across two consecutive samples, or starts flooding output, it gets its own row above the tree: the terminal's name, the reason in plain terms — 62% CPU, or 8.4 MB/s output · throttled — and a Reveal button that brings that exact pane forward, in whatever slot and layout it happens to live in.
Behind the row's ⋯ are the four things you would actually want to do about it: Pause output to stop a firehose without killing the run, Lower priority to drop that terminal's whole process tree below normal so your typing stays smooth, Hibernate to shut the CLI down while keeping the tab and its session, or Close.
You can hand someone the evidence
Copy diagnostic report puts a Markdown summary of the buckets, the top consumers, whether the GPU is rendering, and any recent stalls on your clipboard. It is meant to be pasted into a bug report, so the conversation starts from numbers instead of "it felt slow yesterday."
Underneath the tree, the Machine section reads out RAM used against total, Available, Swap, CPU load against your real core count, and whether WebGL is running on hardware — plus a Busiest other apps list, which is how you learn the browser was at 31% the whole time.
A freeze stops being a mystery
If the window stops responding, a red dot appears in the status bar. That alone is worth something: you know the app is stalled rather than dead, and you stop clicking.
When it comes back, a short toast tells you what happened — "1DevTool paused 6.2 s while system CPU was 98% — top: claude, node". Stalls accumulate under Recent stalls this session, both in the Resource Manager and in Settings → General → Diagnostics, in the same plain wording: "Main paused 3.1 s in command git while system CPU was 25%." The stall threshold lives there too, next to an opt-in for sending stall reports.
The other half: it also uses less
Naming the cost is only useful if the cost then goes down. Most of this release went into that.
Terminals stopped paying for things they should not: switching between grid, columns, rows, single, vertical tabs, chat and vibe keeps the panes you already had open instead of rebuilding each one, jumping back to a pane you just left restores it with its scroll position intact, and GPU rendering now covers more panes at once while off-screen panes give their slot back. When one agent dumps megabytes at once, that pane's output is batched and says so while every other pane keeps typing at full speed — nothing is dropped, the rest arrives when the flood ends. Scrollback is now bounded by memory rather than line count, so a very wide pane keeps fewer rows for the same footprint.
Then there is the memory you were not using at all. Browser tabs in projects you have left unload after they have been idle for a while — fifteen minutes by default, under Settings → Browser — while tabs with unsaved fields, playing audio, driven by an agent, or pinned Keep awake stay put. An agent sitting at its prompt for half an hour hibernates: the CLI shuts down, the tab stays, and the pane reads "Hibernated — press any key or click to resume". It never happens mid-turn, and never to a seat on a running team. You can also trigger it yourself with Hibernate or Hibernate all idle from a terminal's right-click menu, or let the panel's one footer button — Improve performance — sleep tabs, hibernate idle agents and clear buffers in a single step.
And when the machine genuinely runs out of memory, the app yields: background polling pauses and idle tabs sleep sooner. On Windows the programs inside your terminals also drop to below-normal CPU priority until the pressure clears — builds still finish, they just share the CPU more fairly. macOS and Linux will not let an app raise a process's priority back once lowered, so there the Resource Manager's manual Lower priority does the same job for one terminal at a time and lasts until those processes exit. The automatic switch lives in Settings → General → Diagnostics.
The download got smaller too. A macOS install went from 709 MB to 360 MB, with roughly a third of the files it used to ship, and browser automation now drives the Chrome or Edge you already have instead of bundling its own.
Before vs after
| Then | Now |
|---|---|
| One memory number in the status bar | Three buckets that add up to what your OS reports |
| Activity Monitor blames 1DevTool for every agent | The terminals bucket names the split, and says why your OS gets it wrong |
| Map a process id back to a tab, by guessing | Expand a bucket; every terminal is named the way its tab is |
| Kill the whole app to stop one runaway pane | Reveal it, then Pause output, Lower priority, Hibernate or Close |
| "It felt slow yesterday" | Copy diagnostic report → paste into the issue |
| The window freezes and you wonder if it died | A red dot while it stalls, and a toast naming the cause after |
| Twelve idle agents hold their memory forever | Idle agents hibernate; other projects' browser tabs unload |
Who benefits most
If you run many agents at once, this is the release that makes that sustainable — the panes you are not watching stop costing you, and the one that is misbehaving is now a row with a Reveal button.
If you work on a 16 GB machine, the hibernation, tab unloading and low-memory behaviour are doing work for you whether or not you ever open the panel.
If you have ever filed a "the app is slow" report, Copy diagnostic report turns a feeling into a paste-able set of numbers — including the ones that exonerate us.
Try it
Update to v1.71.0 and click the memory reading in your status bar. Whatever the number says, you will finally know how much of it is us, how much is the agents you started, and how much was never ours to begin with — and which pane to go and deal with first.