Response Inspector
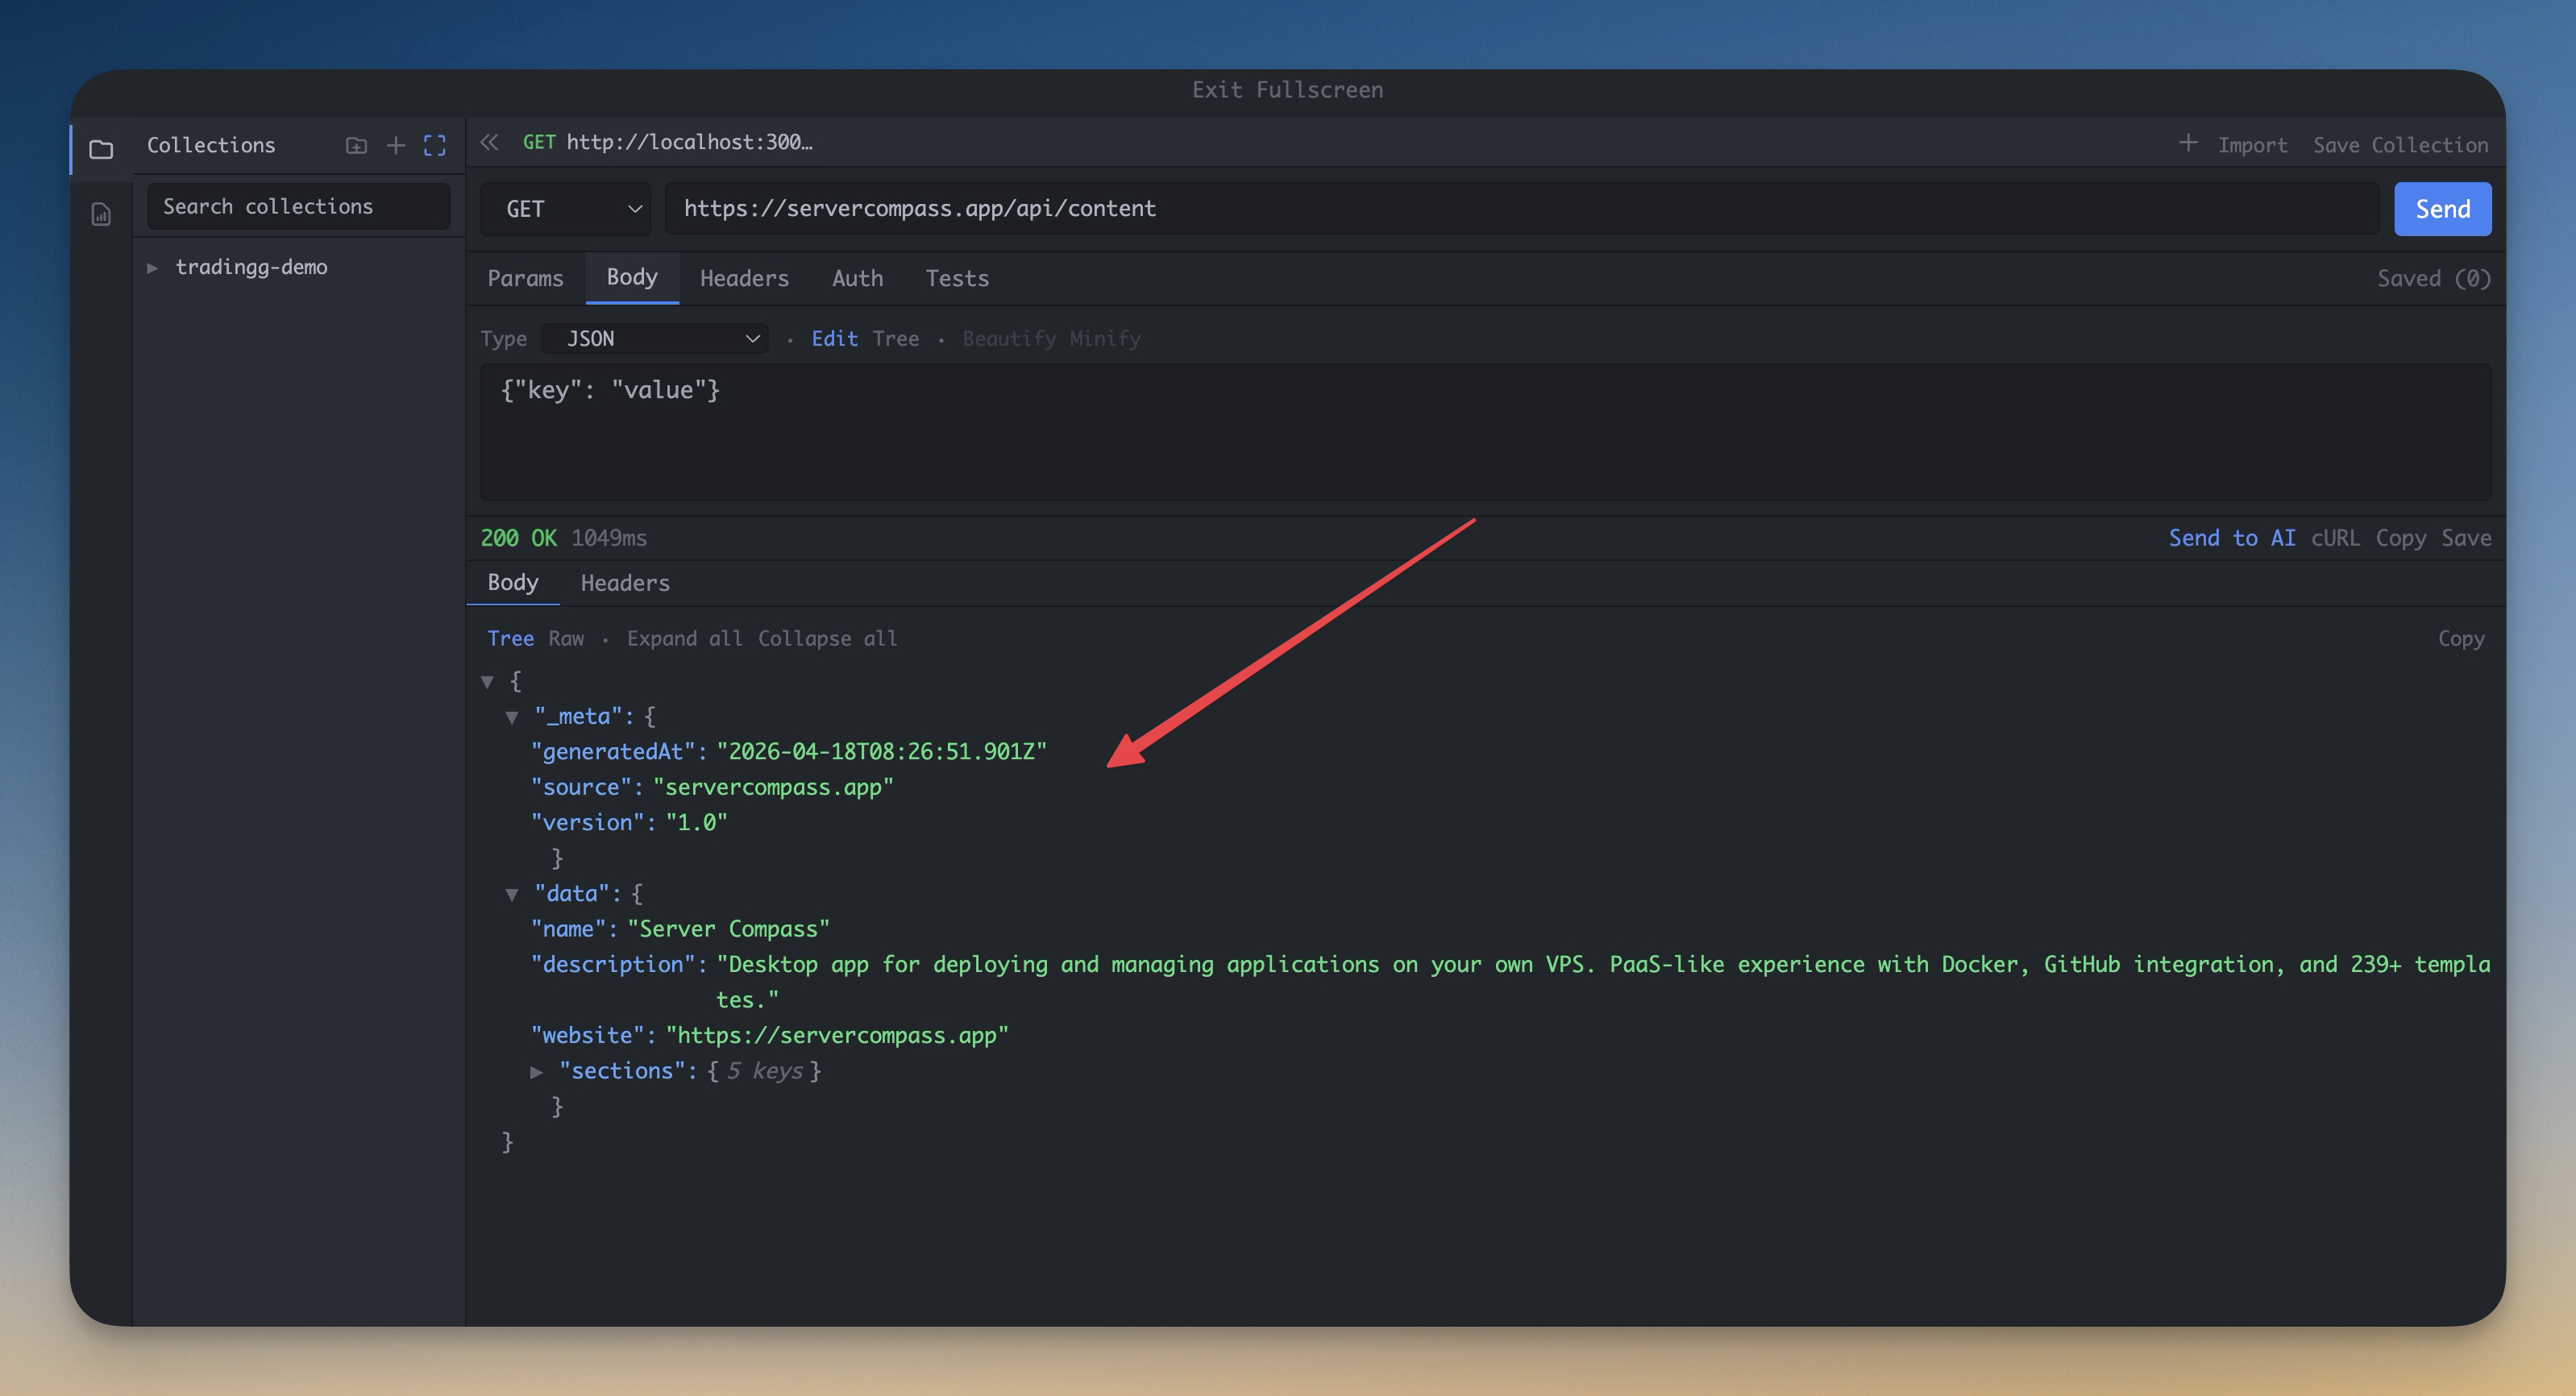
Inspect formatted JSON, headers, status codes, latency, and response structure with a readable tree viewer.
More Screenshots
Click any image to zoom in
Why You Need This
How this feature boosts your daily productivity
Raw API responses are hard to read and easy to misinterpret. The Response Inspector turns dense payloads into a searchable, structured view with formatted JSON, headers in a clean table, and status plus timing details that are easy to scan. That means you can spot a missing field, malformed body, or slow endpoint in seconds instead of copying the payload into another tool just to understand it.
How It Works
Get started in 4 simple steps
Set Up Your Request
Choose the HTTP method, enter the URL, and configure headers, auth, and body in the tabbed interface.
Send & Inspect
Hit send and see the response instantly — formatted JSON, headers, status code, and latency metrics.
Save & Organize
Save requests in tabs for quick re-use. Each project maintains its own request workspace and URL history.
Share & Debug
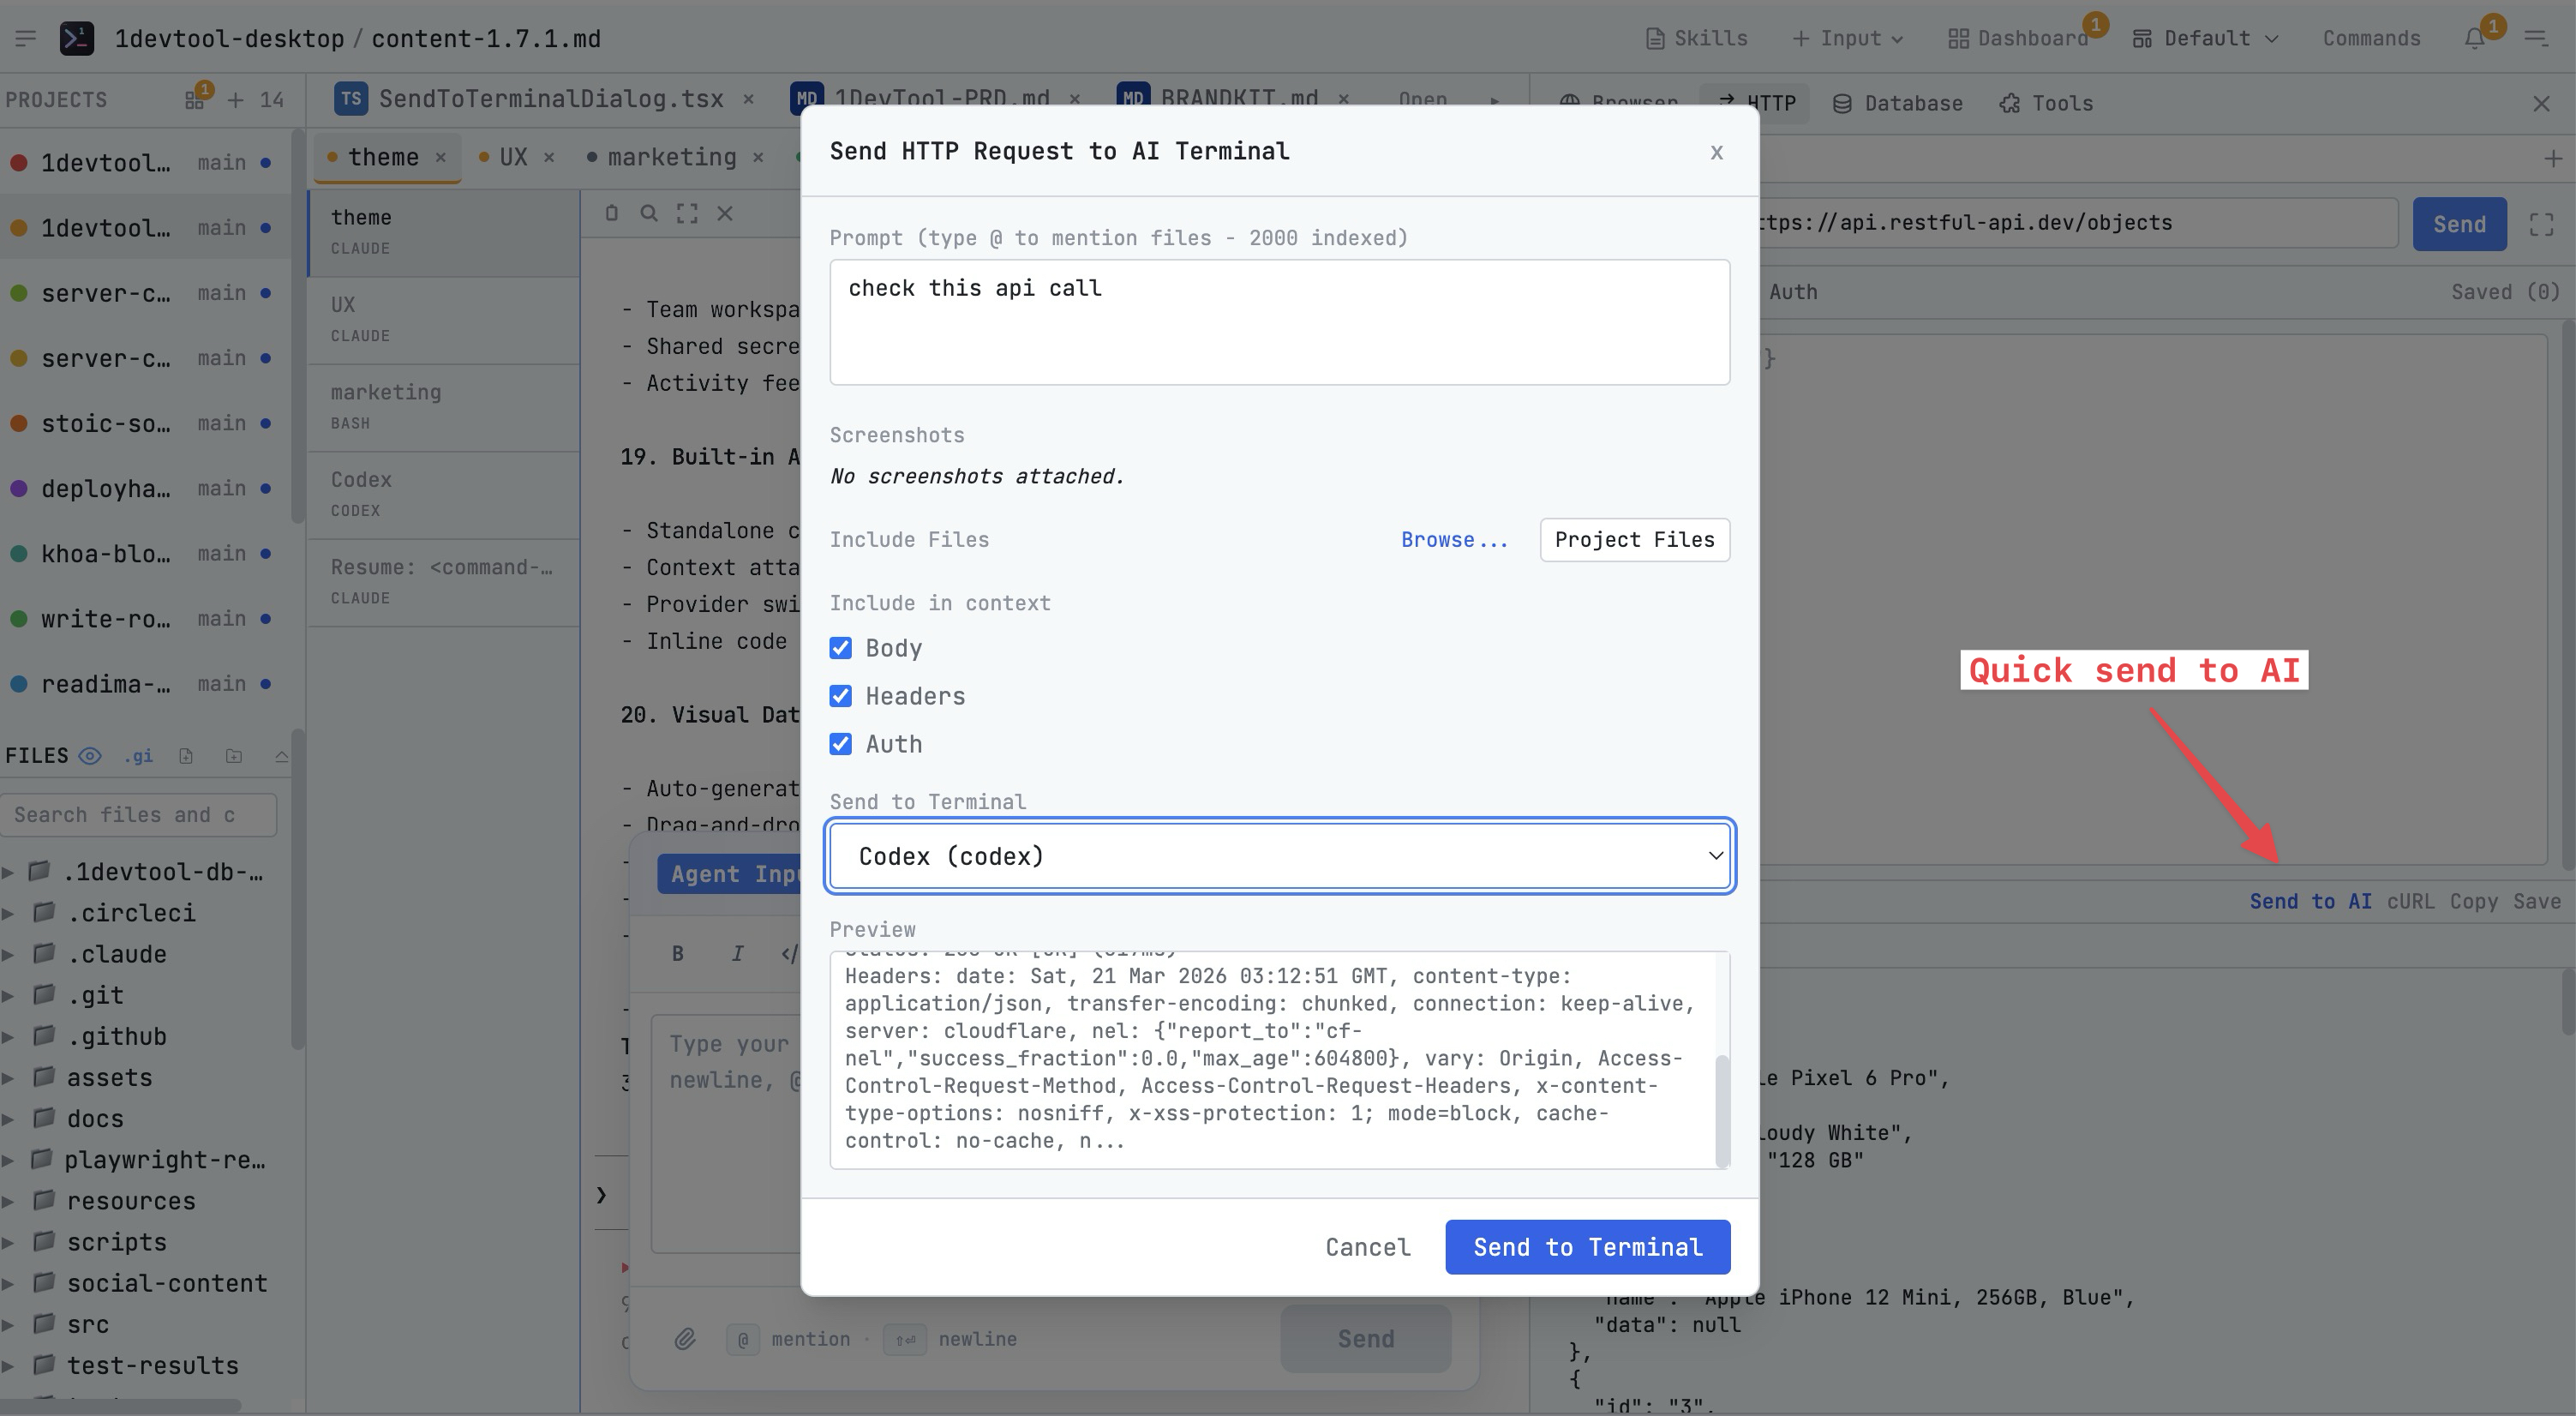
Copy as cURL for sharing. Send response data to your AI agent for analysis or debugging assistance.
Without 1DevTool
The manual way vs. the 1DevTool way
The Hard Way
The 1DevTool Way
Key Capabilities
Everything included with Response Inspector
Why It Matters
The productivity impact of having http client built into your workspace
No App Switching
Test APIs right next to your terminal and code. No more copying tokens to Postman or Insomnia.
Organized Requests
Multi-tab workspaces and saved requests keep your API testing organized per project.
Instant Debugging
Formatted responses, latency metrics, and copy-as-cURL make API debugging fast and shareable.
AI Integration
Send response data directly to your AI agent for analysis, documentation, or debugging assistance.
More in HTTP Client
Other features in this category you might find useful
API Request Builder
Full Postman-like request builder with method selector, custom headers, body editor, and auth support.
Request Tabs & Collections
Organize API work in nested collections with folder trees, saved tabs, request history, and reusable environments.
Postman, Insomnia & Bruno Import/Export
Bring existing API collections into 1DevTool and export them back out without rebuilding your request library.
Click-to-Open HTTP Collections
Click a Postman v2.1, Insomnia v4, or Bruno collection in the file explorer and every request opens in the HTTP client immediately — no import dialog, no format picker, no copy-paste. Folder hierarchies and environment files are preserved, and re-clicking an already-imported file fast-jumps to that request instead of re-importing.
Ready to boost your workflow?
Download 1DevTool for free and experience Response Inspector along with 170 other features — all in one app.