Charts
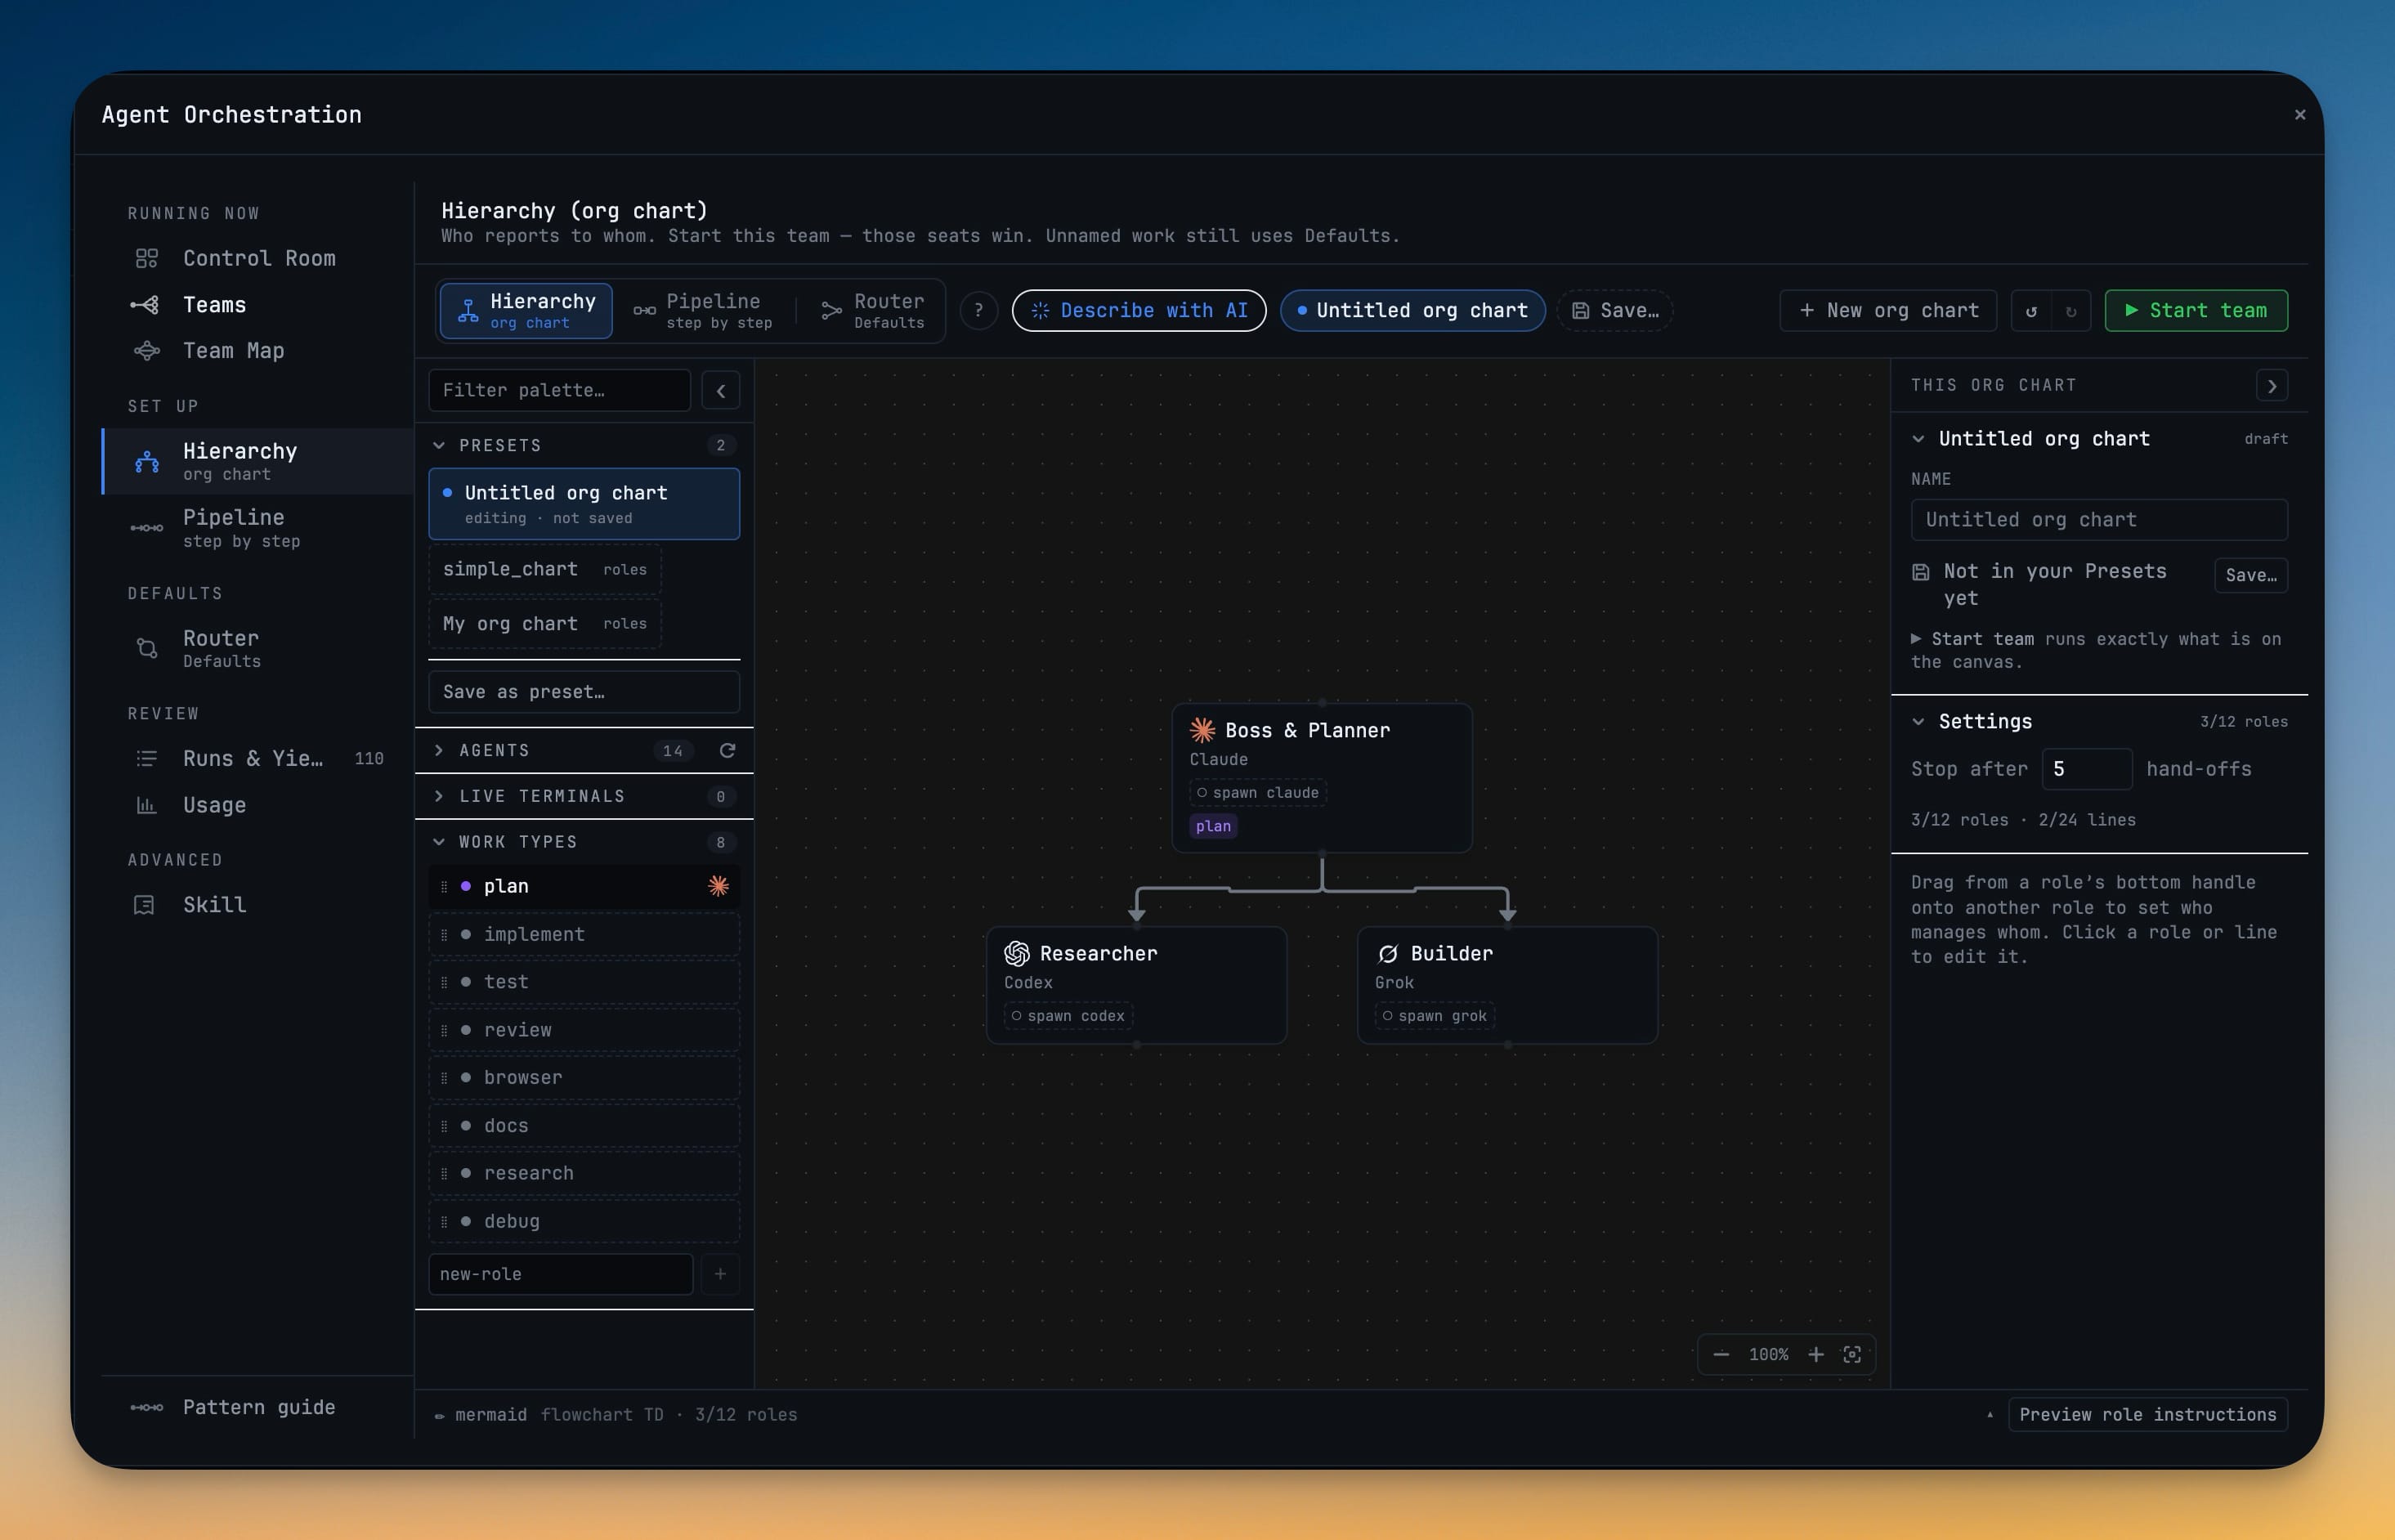
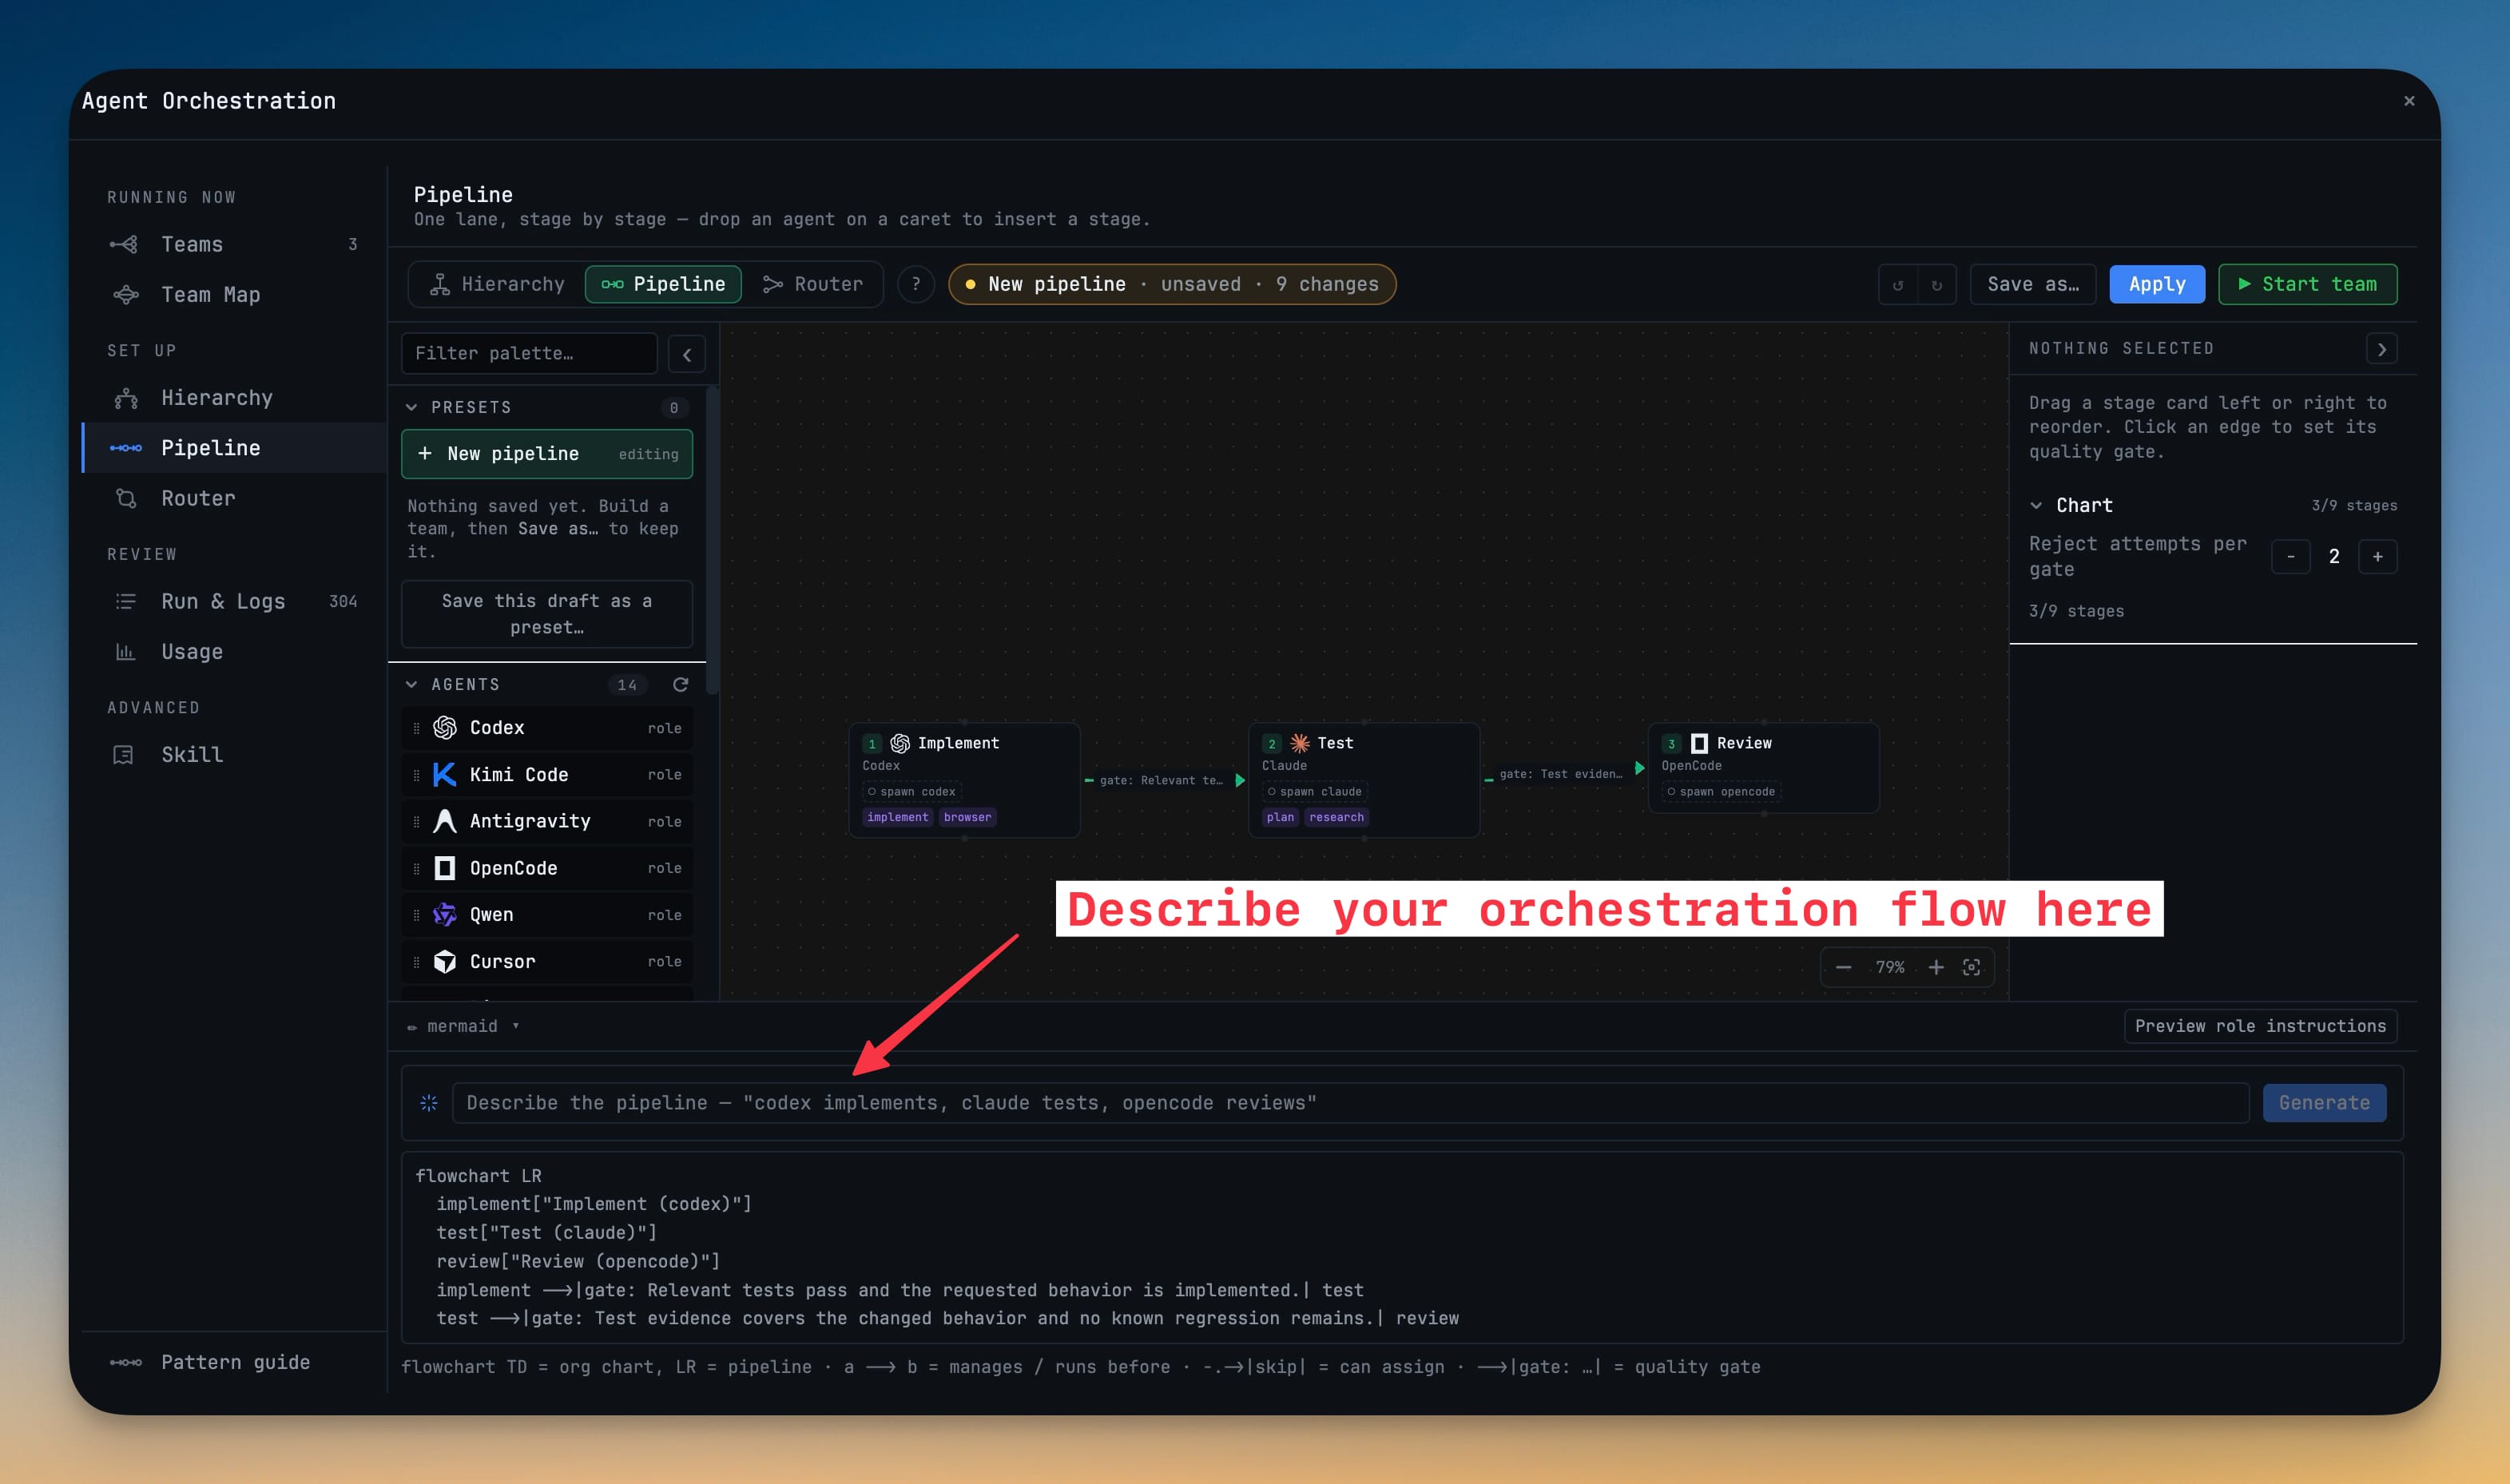
Draw your agent team on a canvas instead of filling in set-up forms — drag agents in, wire them together, and read the team back before anything starts. Charts is one library for every org chart and pipeline you have saved, and nothing runs until you press ▶ Start team.
More Screenshots
Click any image to zoom in
Why You Need This
How this feature boosts your daily productivity
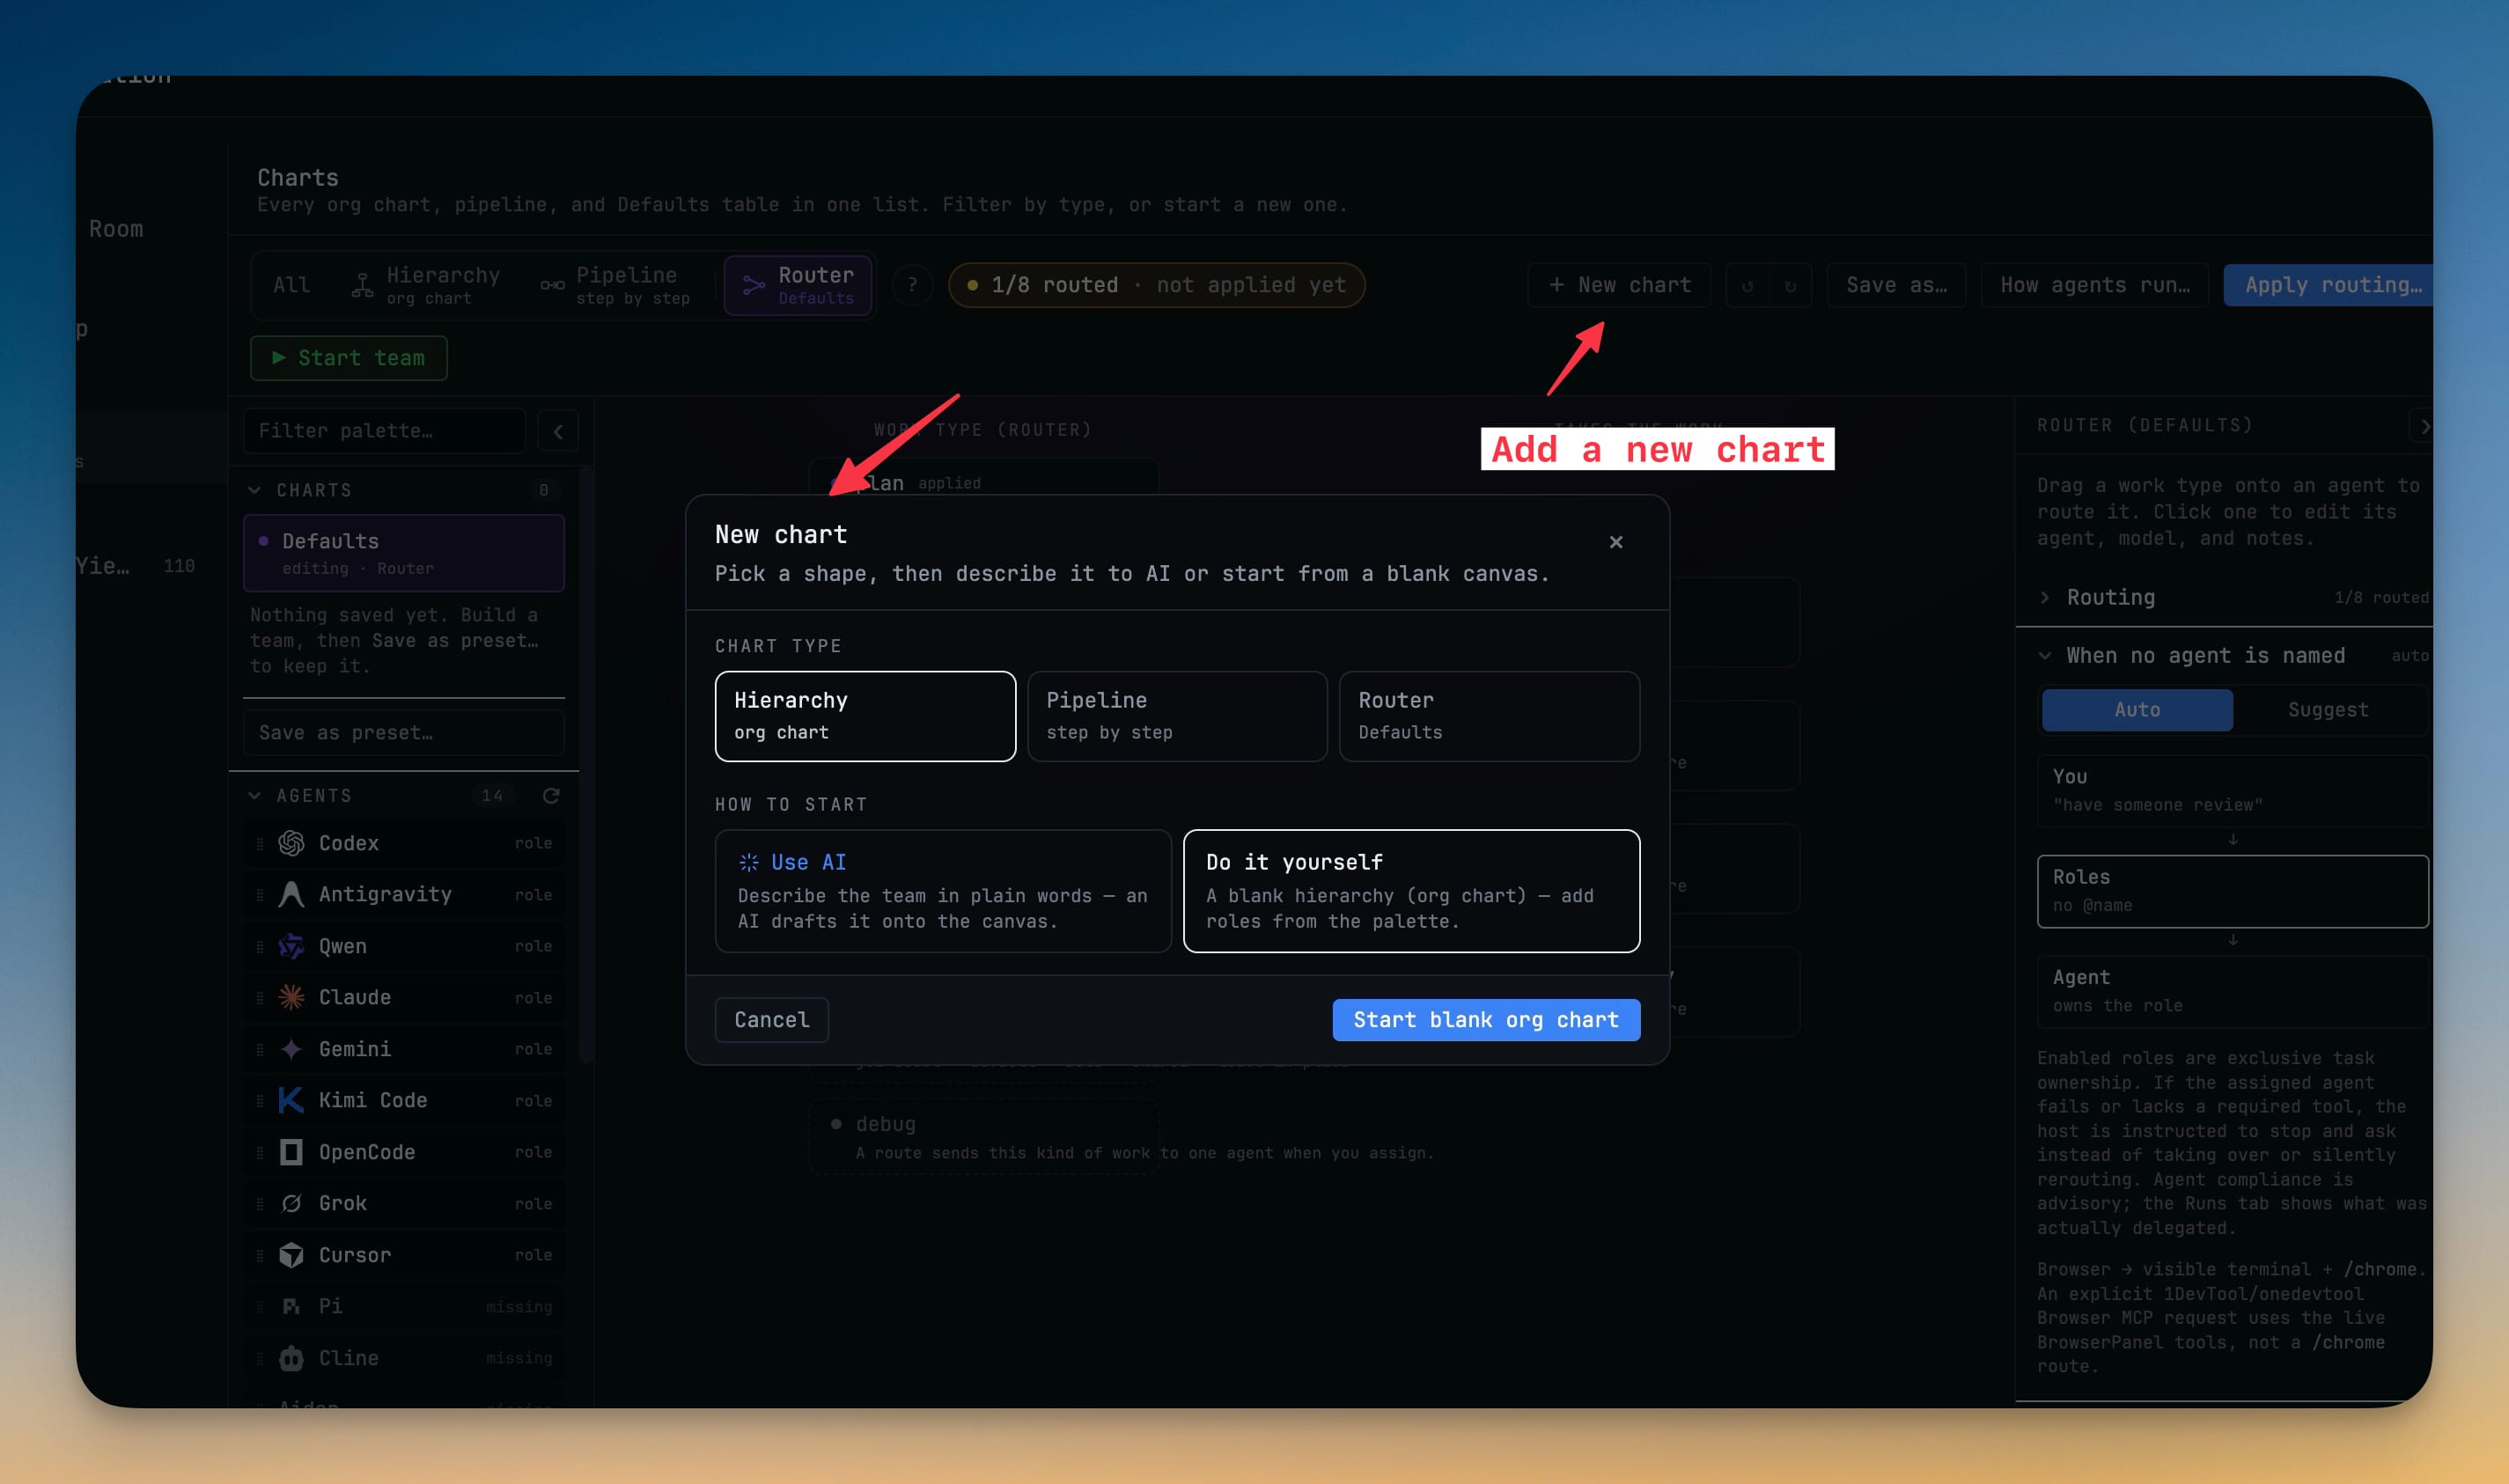
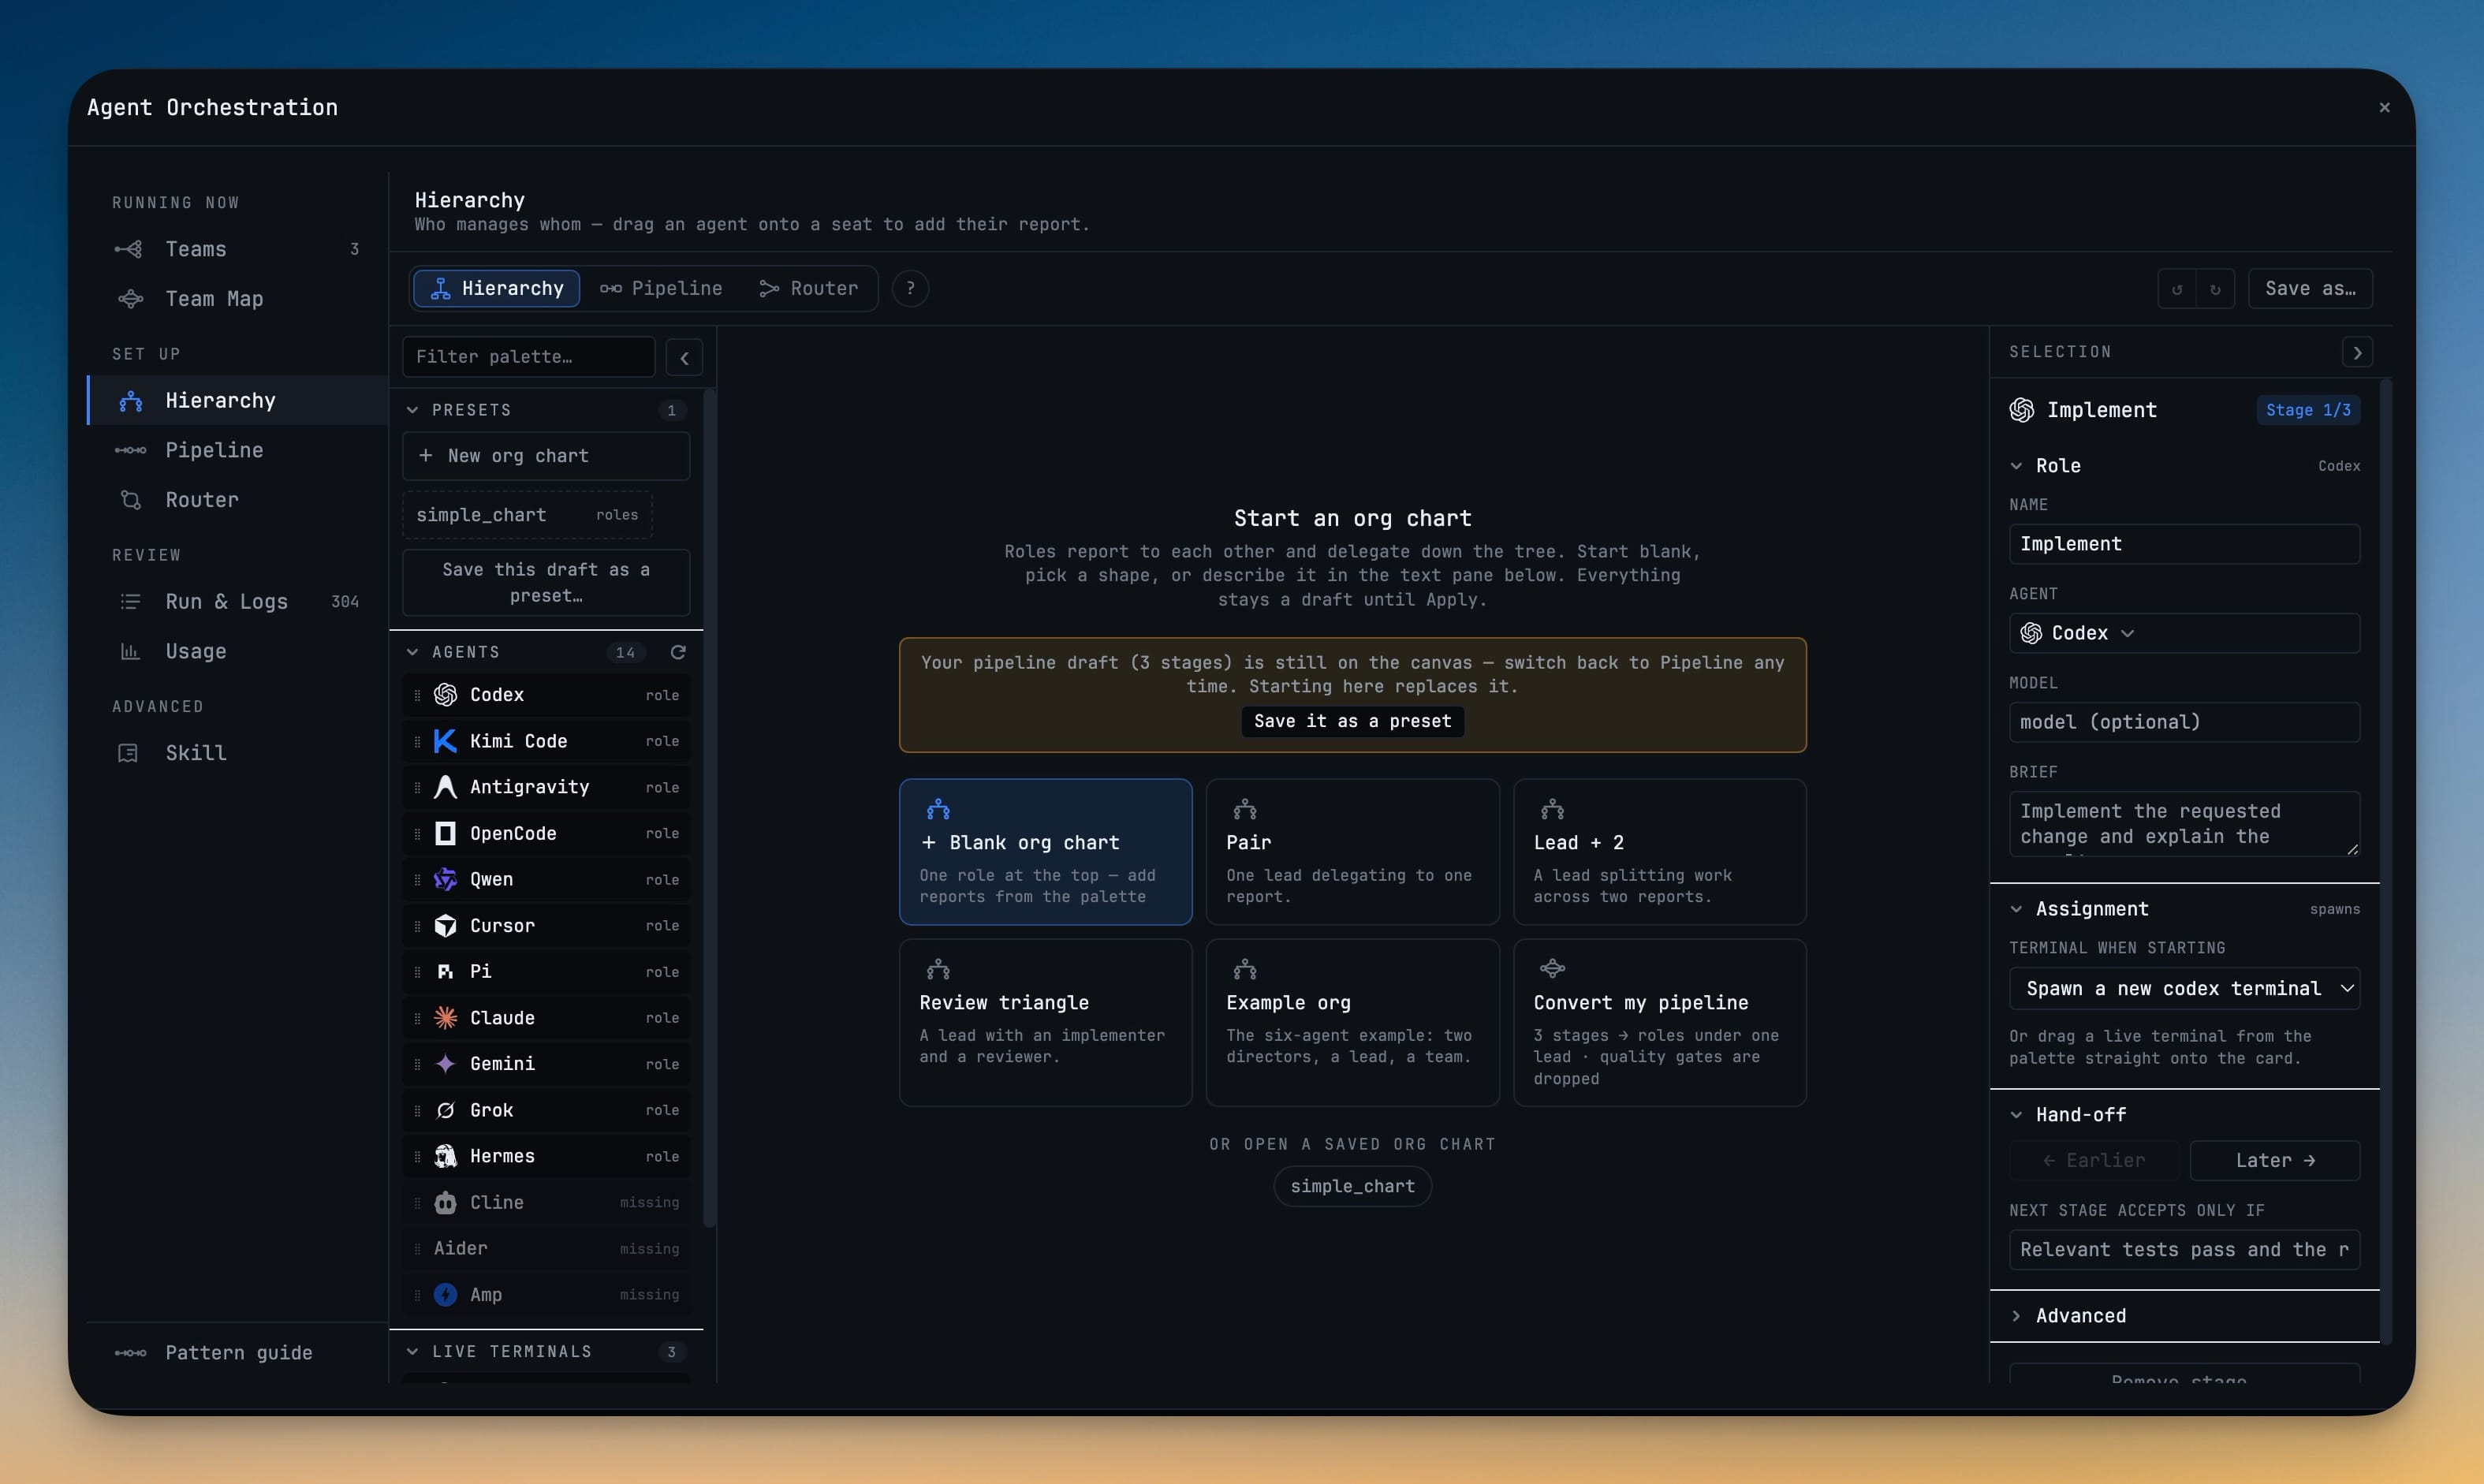
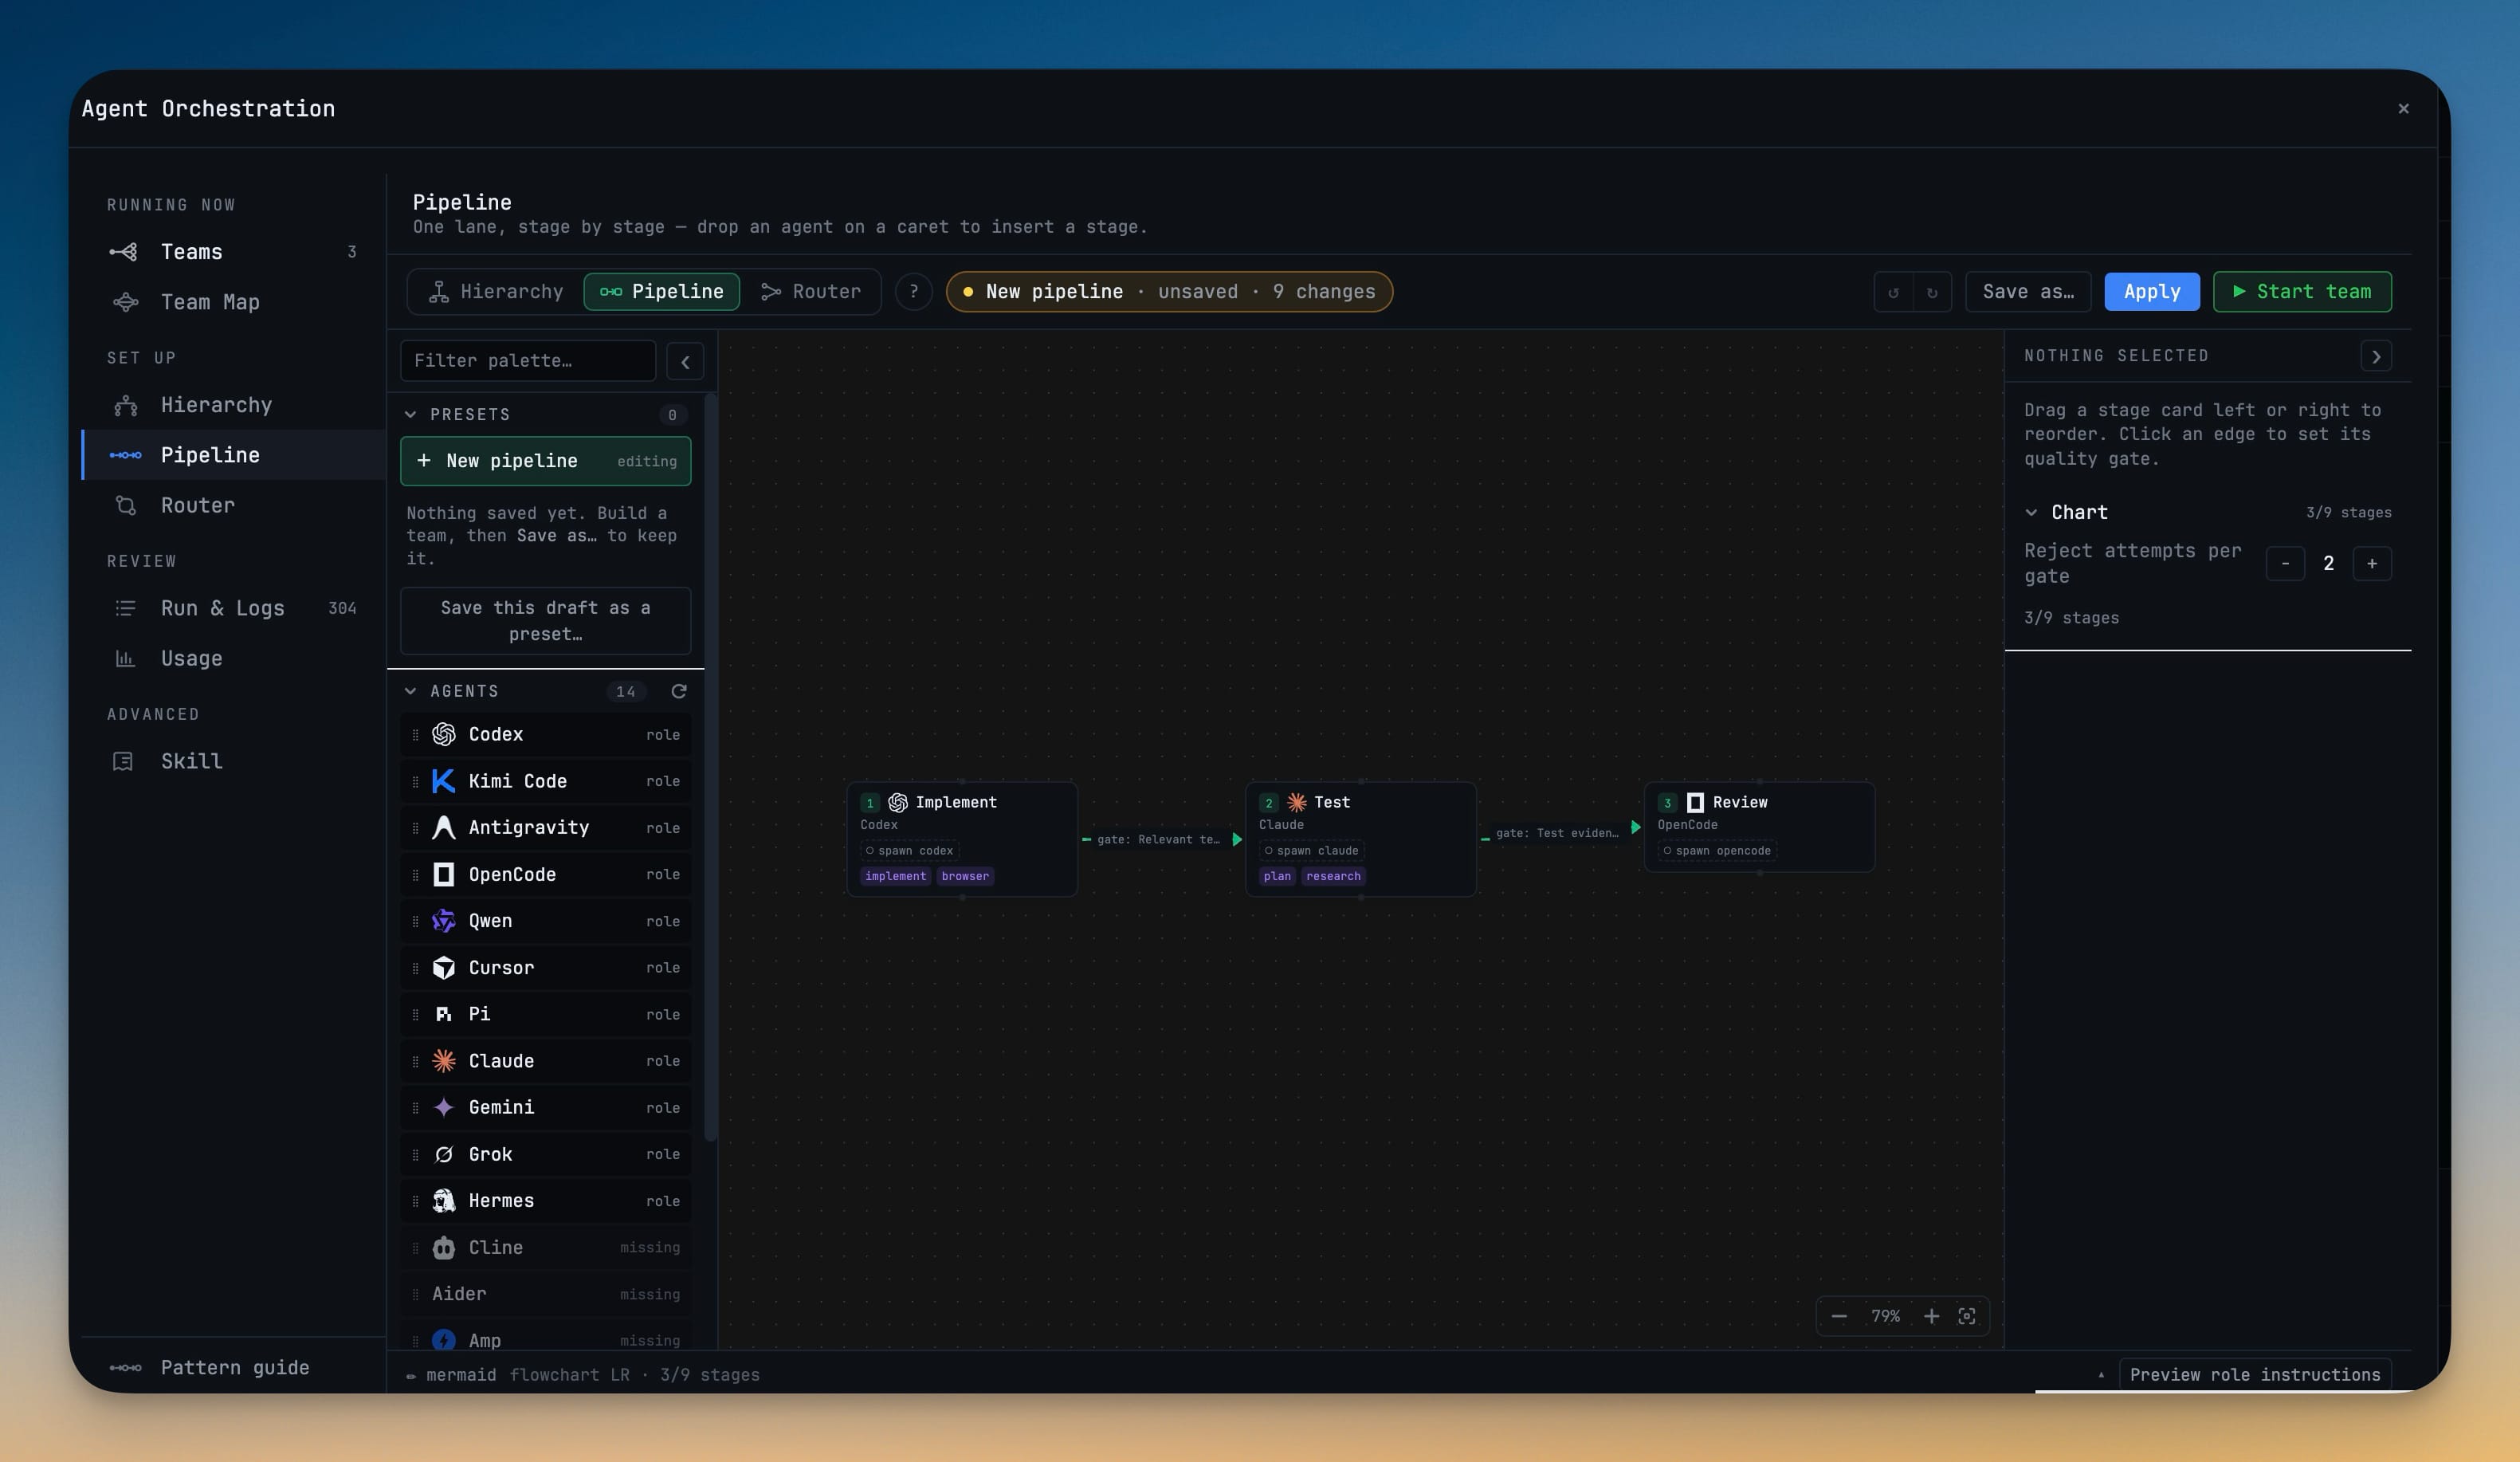
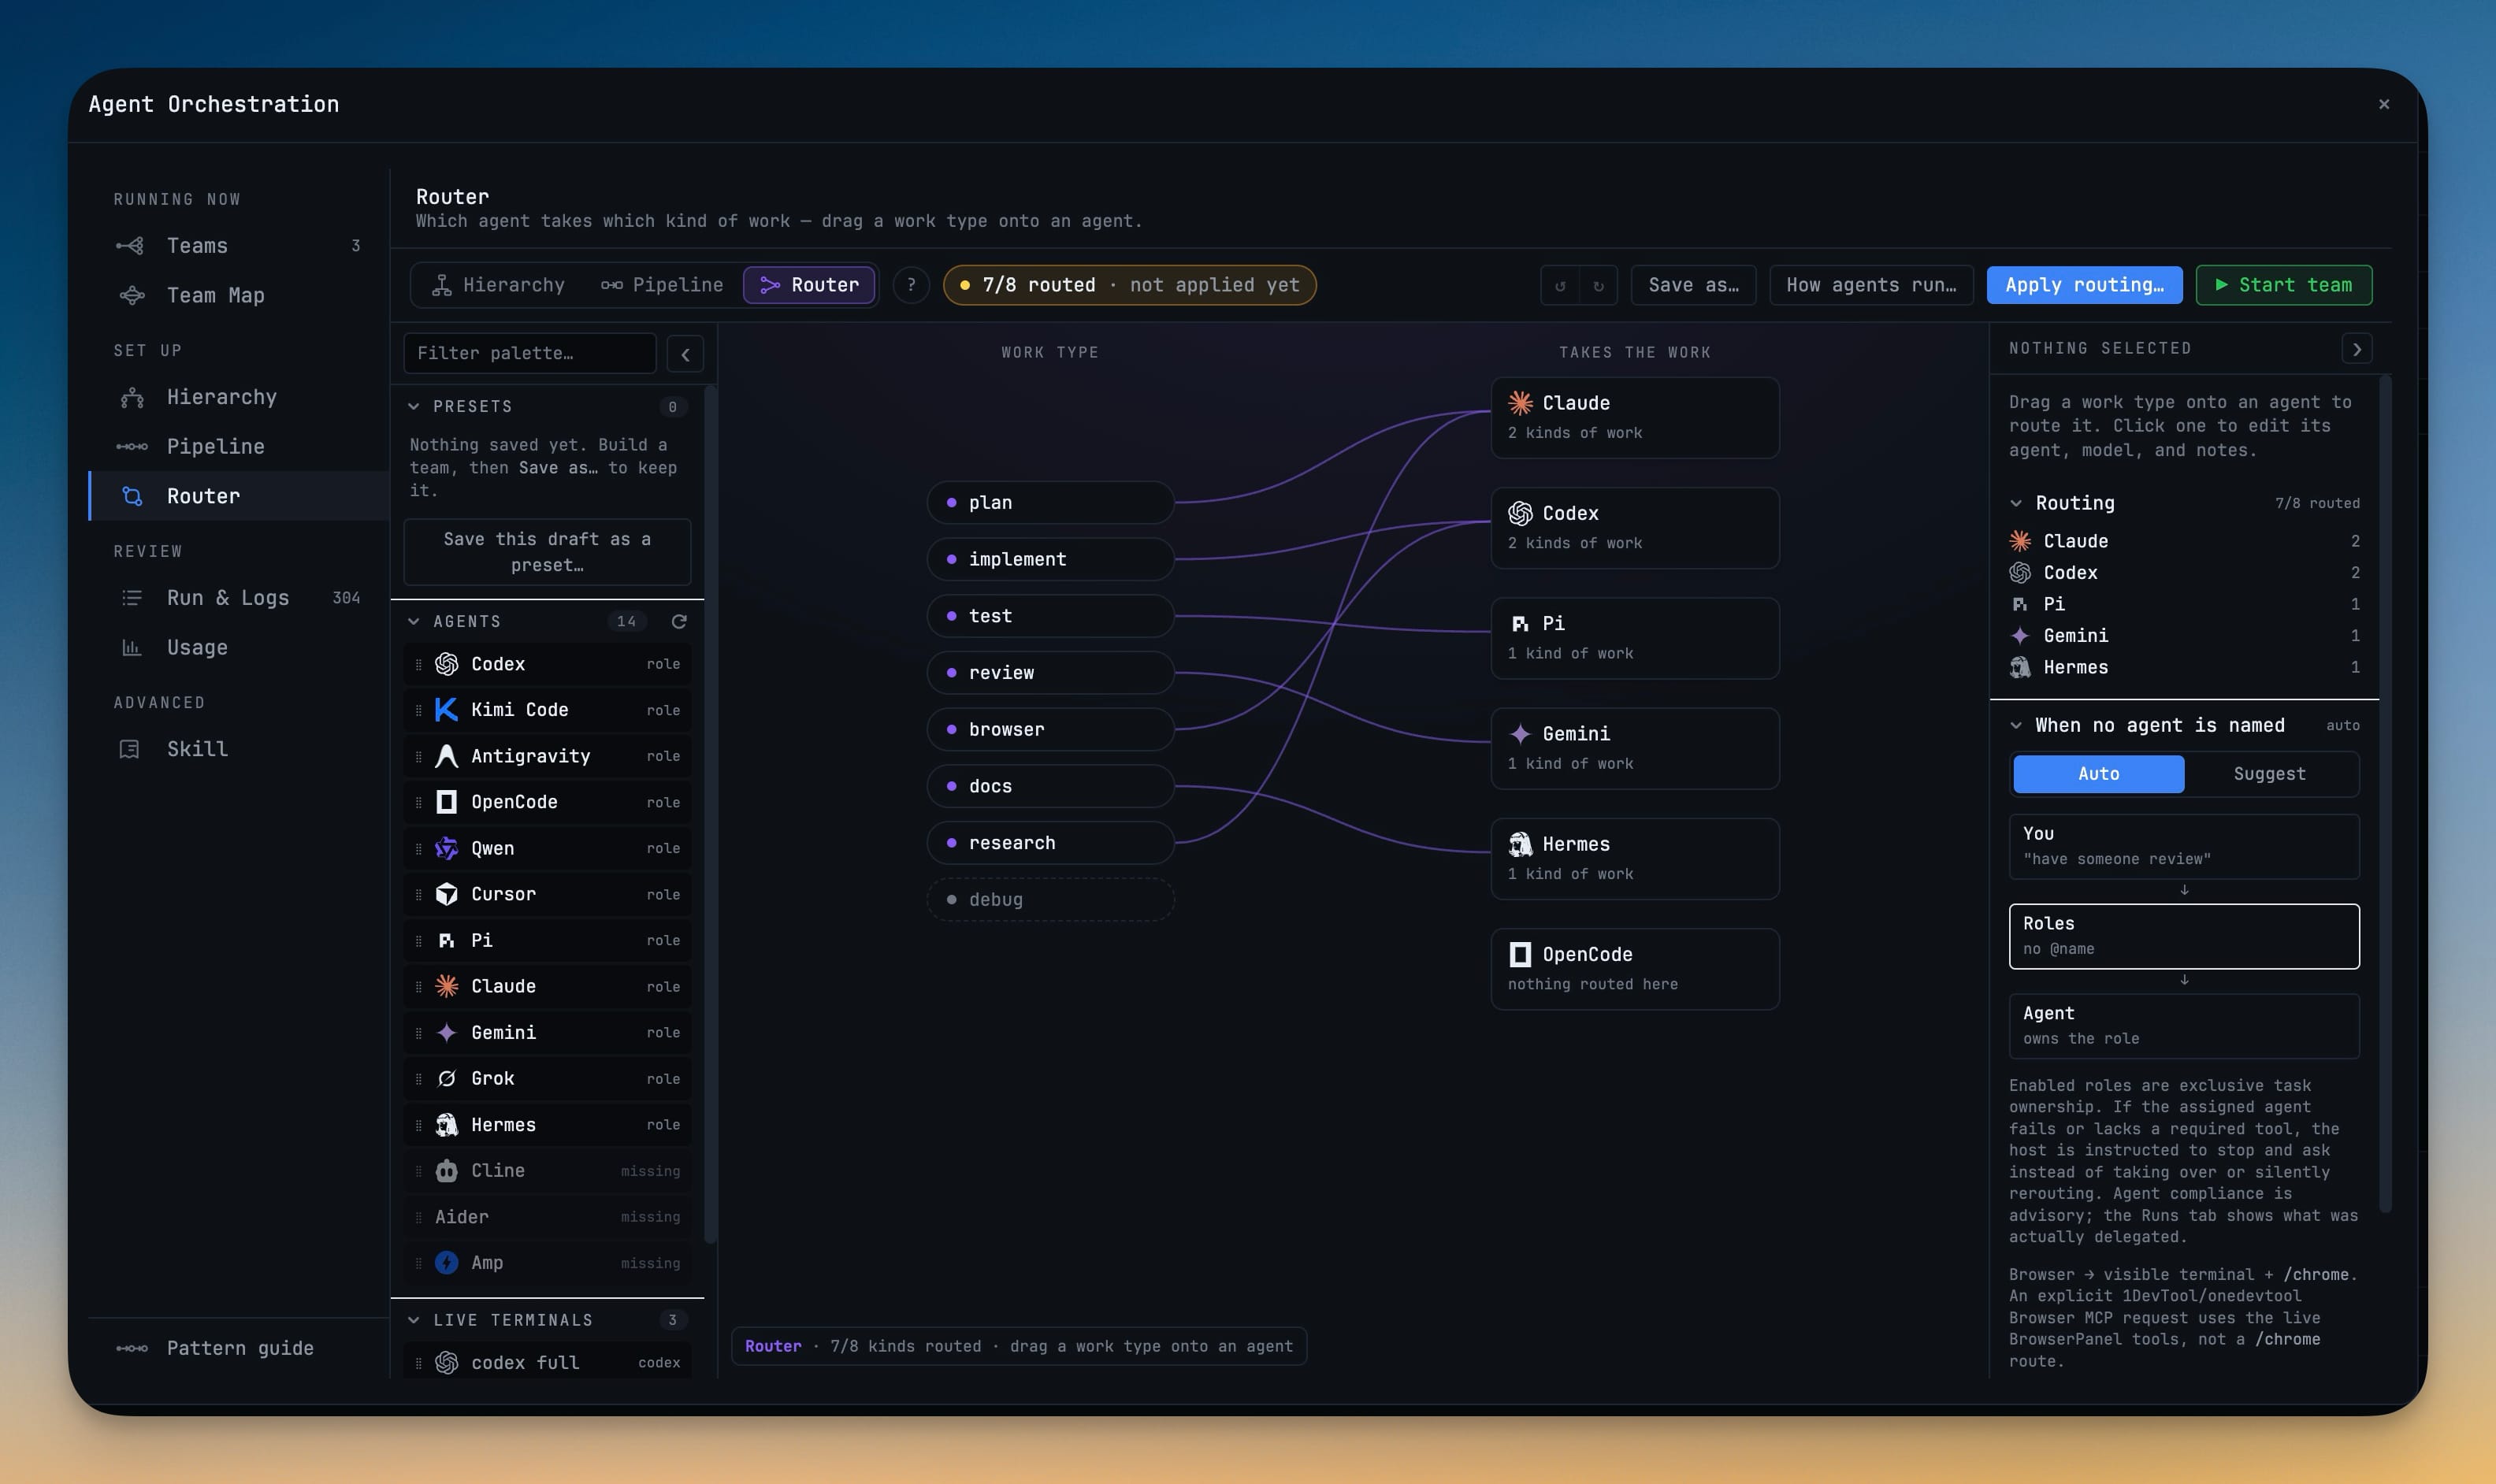
Setting up a multi-agent team used to mean describing a shape you could not see: a role in one field, a reporting relationship in a dropdown pointing at a name you typed three fields earlier, and no picture of the result until you pressed Start and watched it behave. Charts makes the team the thing on screen. It lives under Set up in the orchestration dashboard and does exactly one job — draw the relationships between your terminals, who reports to whom and who hands work to whom — while Defaults, the table for unnamed work and fallbacks, sits separately under Advanced. A palette rail holds your agents, the terminals already running, work types and saved charts; with two or more AI terminals open, a Chain my open terminals card drops exactly those terminals into a pipeline with their seats already filled. Every consequential action explains itself first: a New chart dialog picks the shape and whether an AI drafts it or you start blank, opening a saved chart over unsaved edits previews the canvas and offers Save edits first, Cancel or Discard and load, converting a pipeline into an org chart is its own card rather than a side effect of a mode switch, and each shape keeps its own draft. ⌘Z undoes anything, including an AI draft. If you would rather write than draw, Describe with AI turns "a lead that reviews two implementers" into a chart, and a text pane round-trips the whole team to a readable diagram syntax and back.
How It Works
Get started in 4 simple steps
Open Orchestration → Set up → Charts
One library holds every org chart and pipeline you have saved. You land on a canvas instead of a set-up flow, with a palette rail holding agents, live terminals, work types and your saved charts.
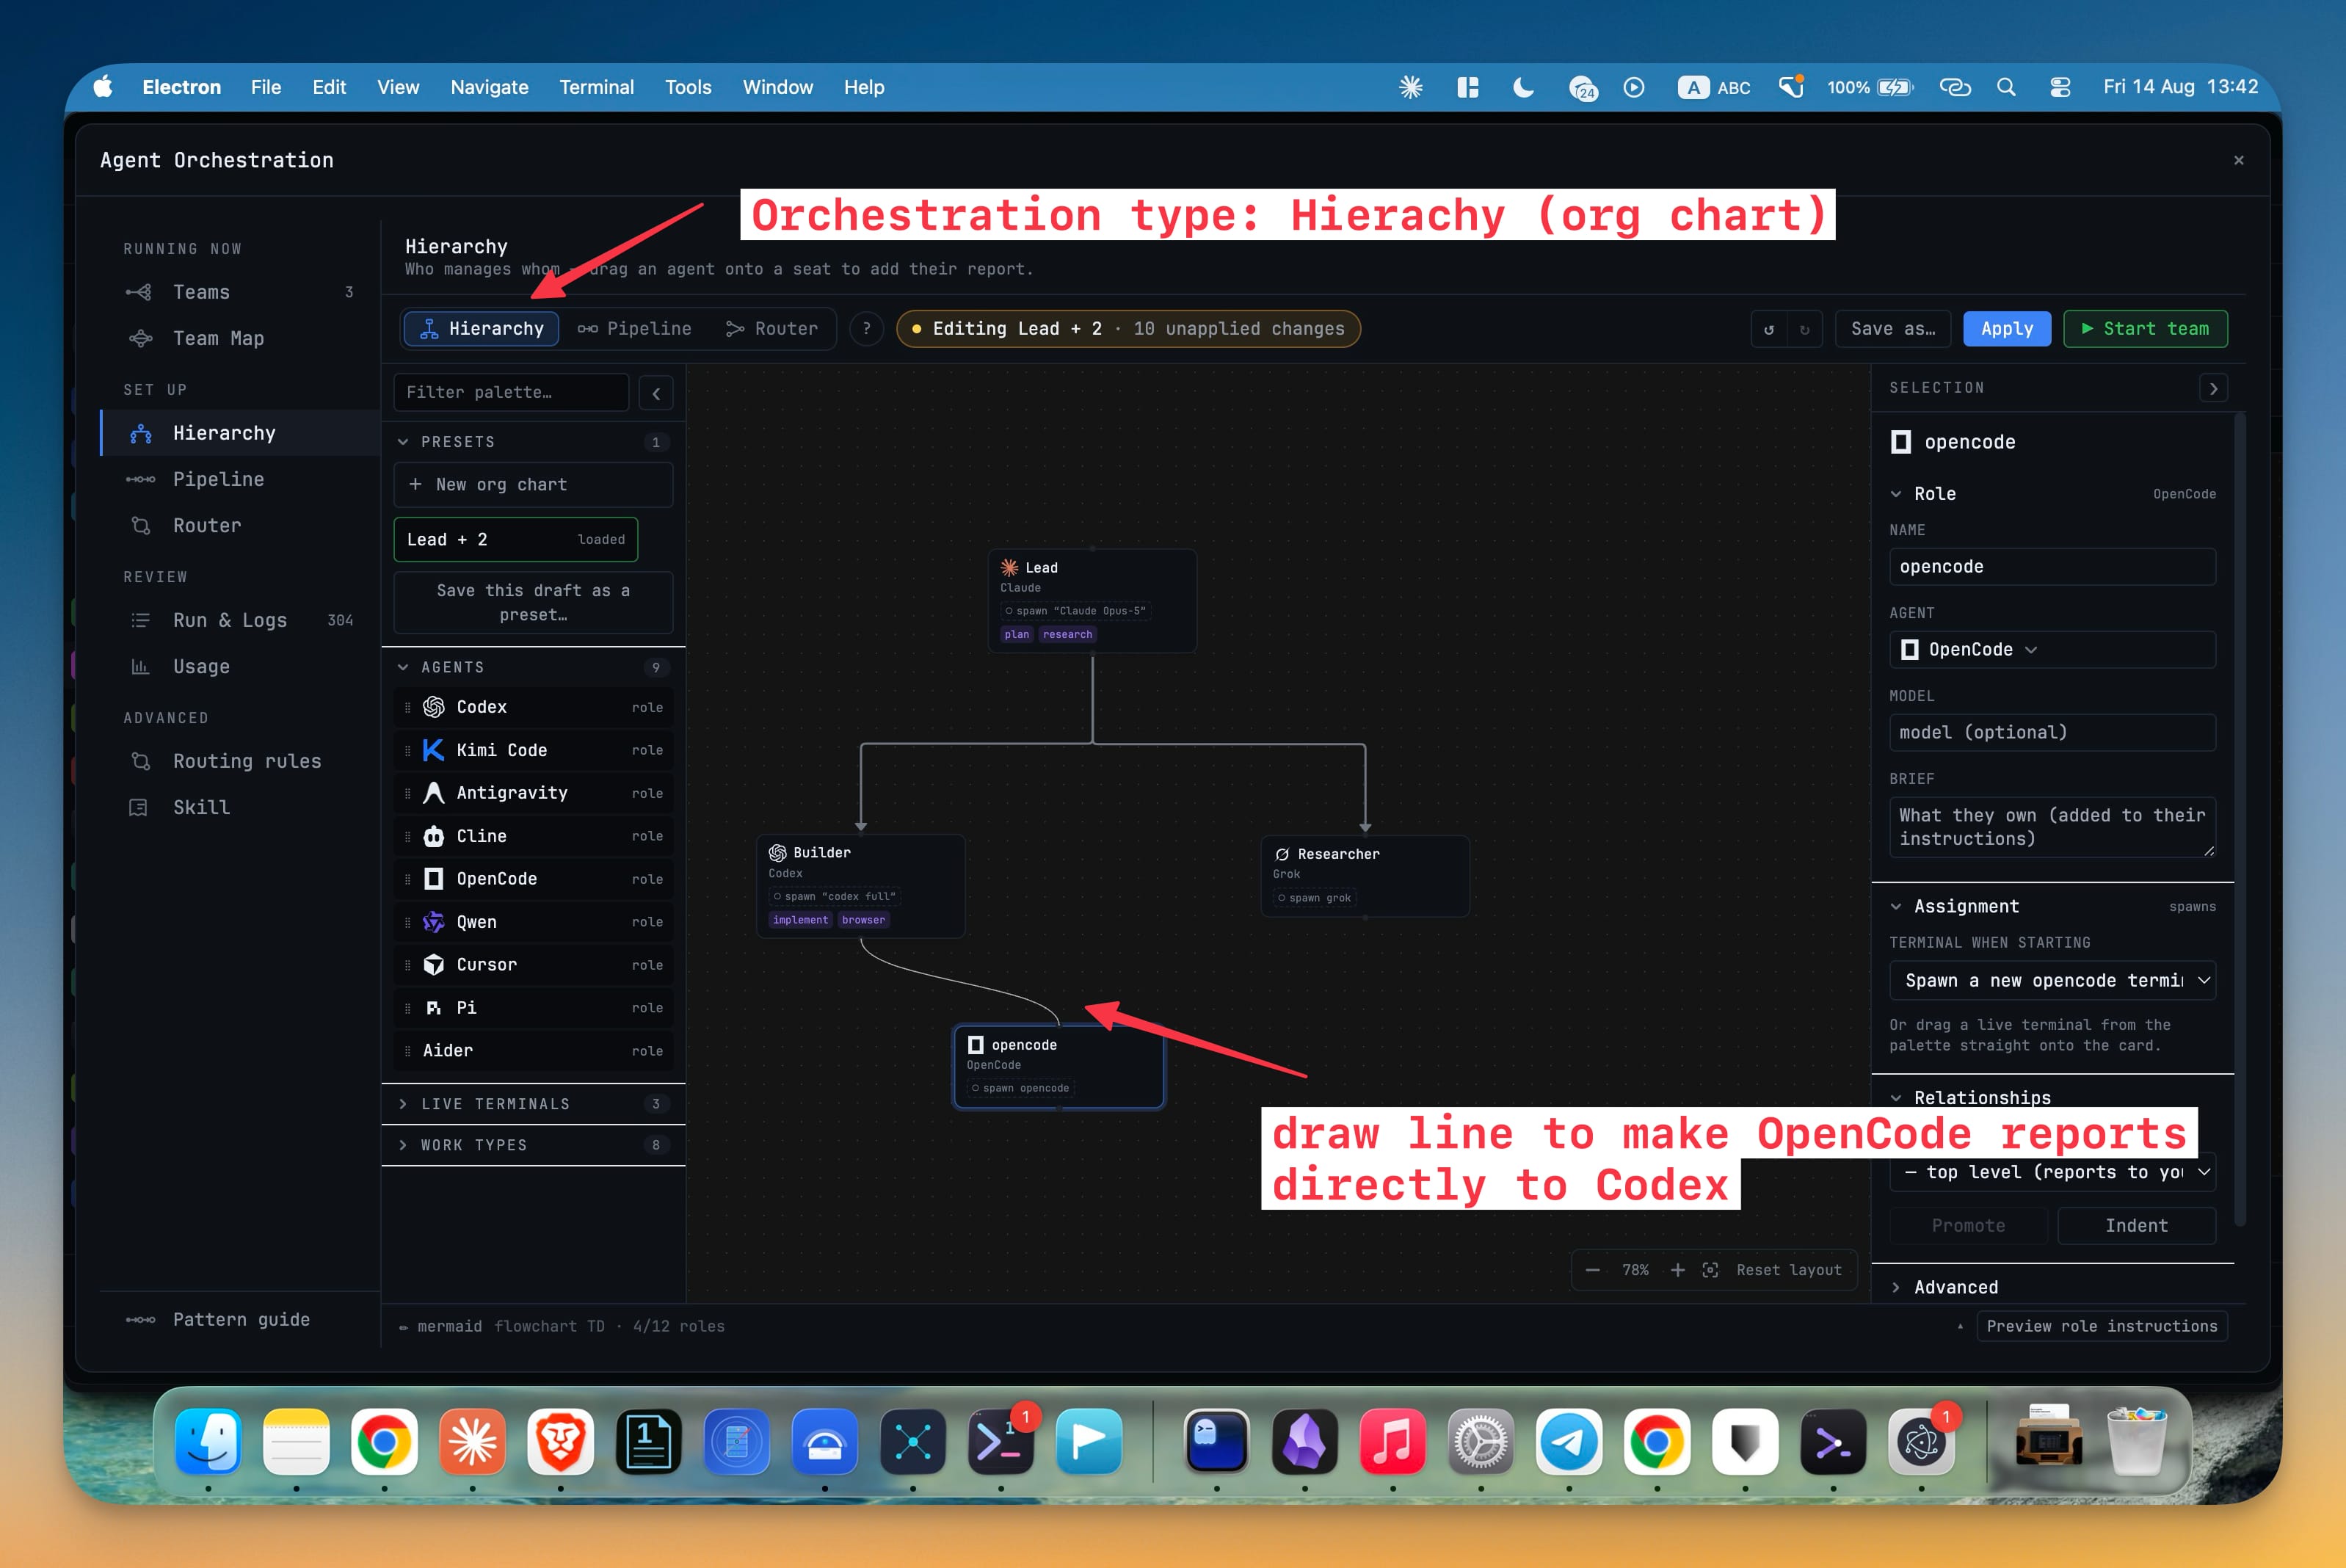
Drag agents in and wire them together
Start a drag and the canvas raises the places you can drop. A seat that cannot take what you are dragging simply dims, so a refusal never costs you a dialog.
Edit any seat or wire in the inspector
Click a seat or a wire to set its role, agent, model and brief. ⌘Z undoes anything you did on the canvas.
Switch shape without losing work
Hierarchy and Pipeline each keep their own draft, so looking at one never converts the other. Converting is its own Convert my pipeline / Convert my org chart card that you choose, and Defaults — the table for unnamed work and fallbacks — lives separately under Advanced.
Read the diff before you apply
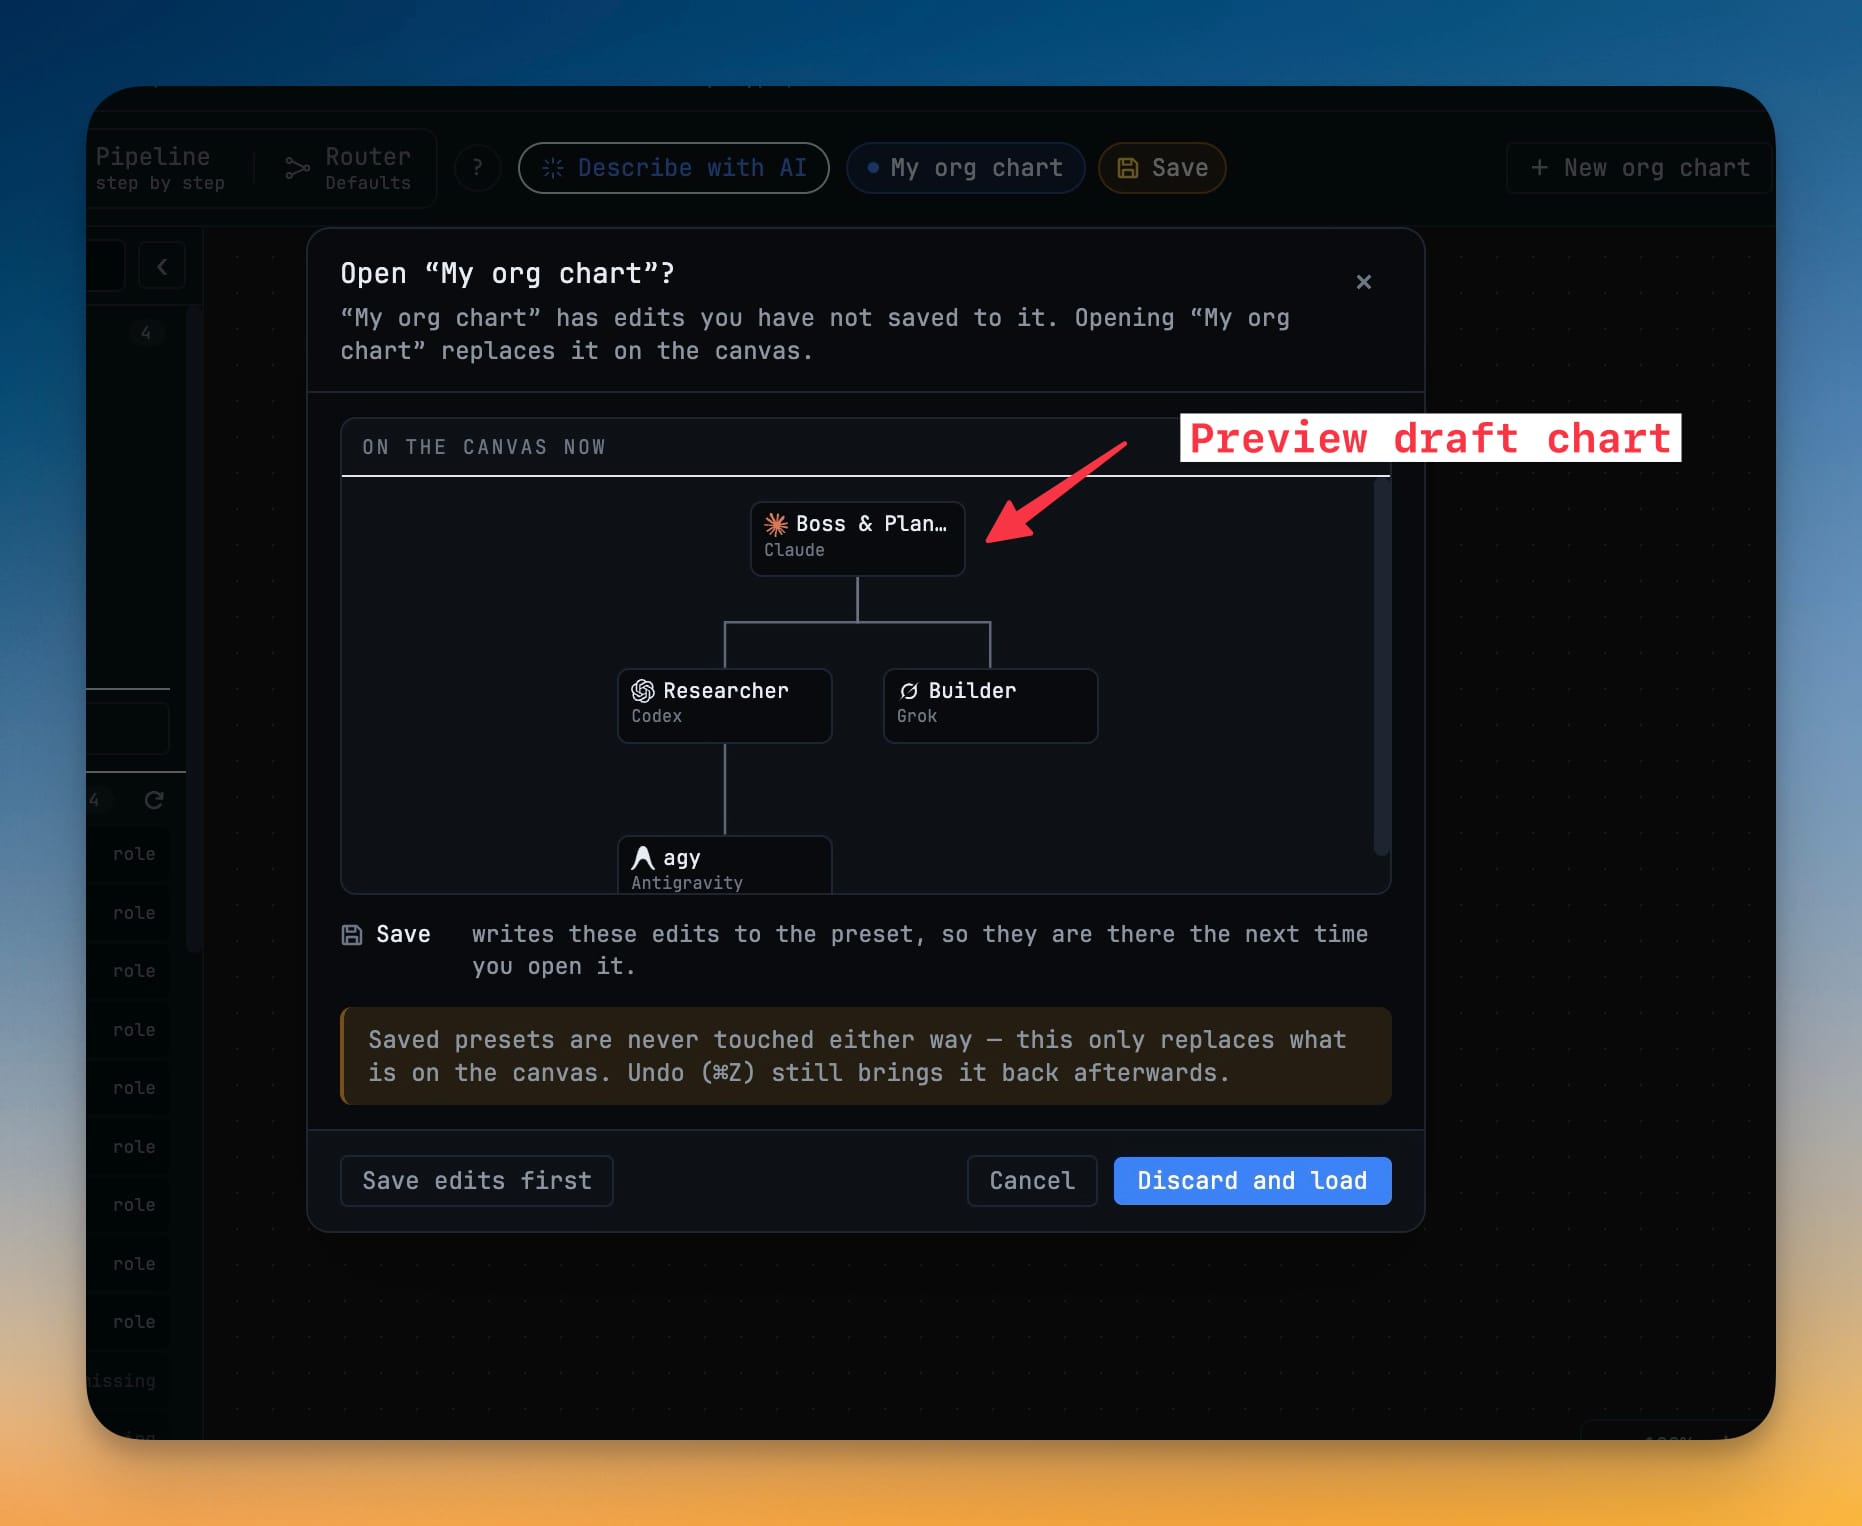
Every consequential action states what it will do first, so Apply is a decision rather than a surprise. Opening a saved chart over unsaved edits previews the canvas and offers Save edits first, Cancel or Discard and load.
Or describe it and let an AI draw it
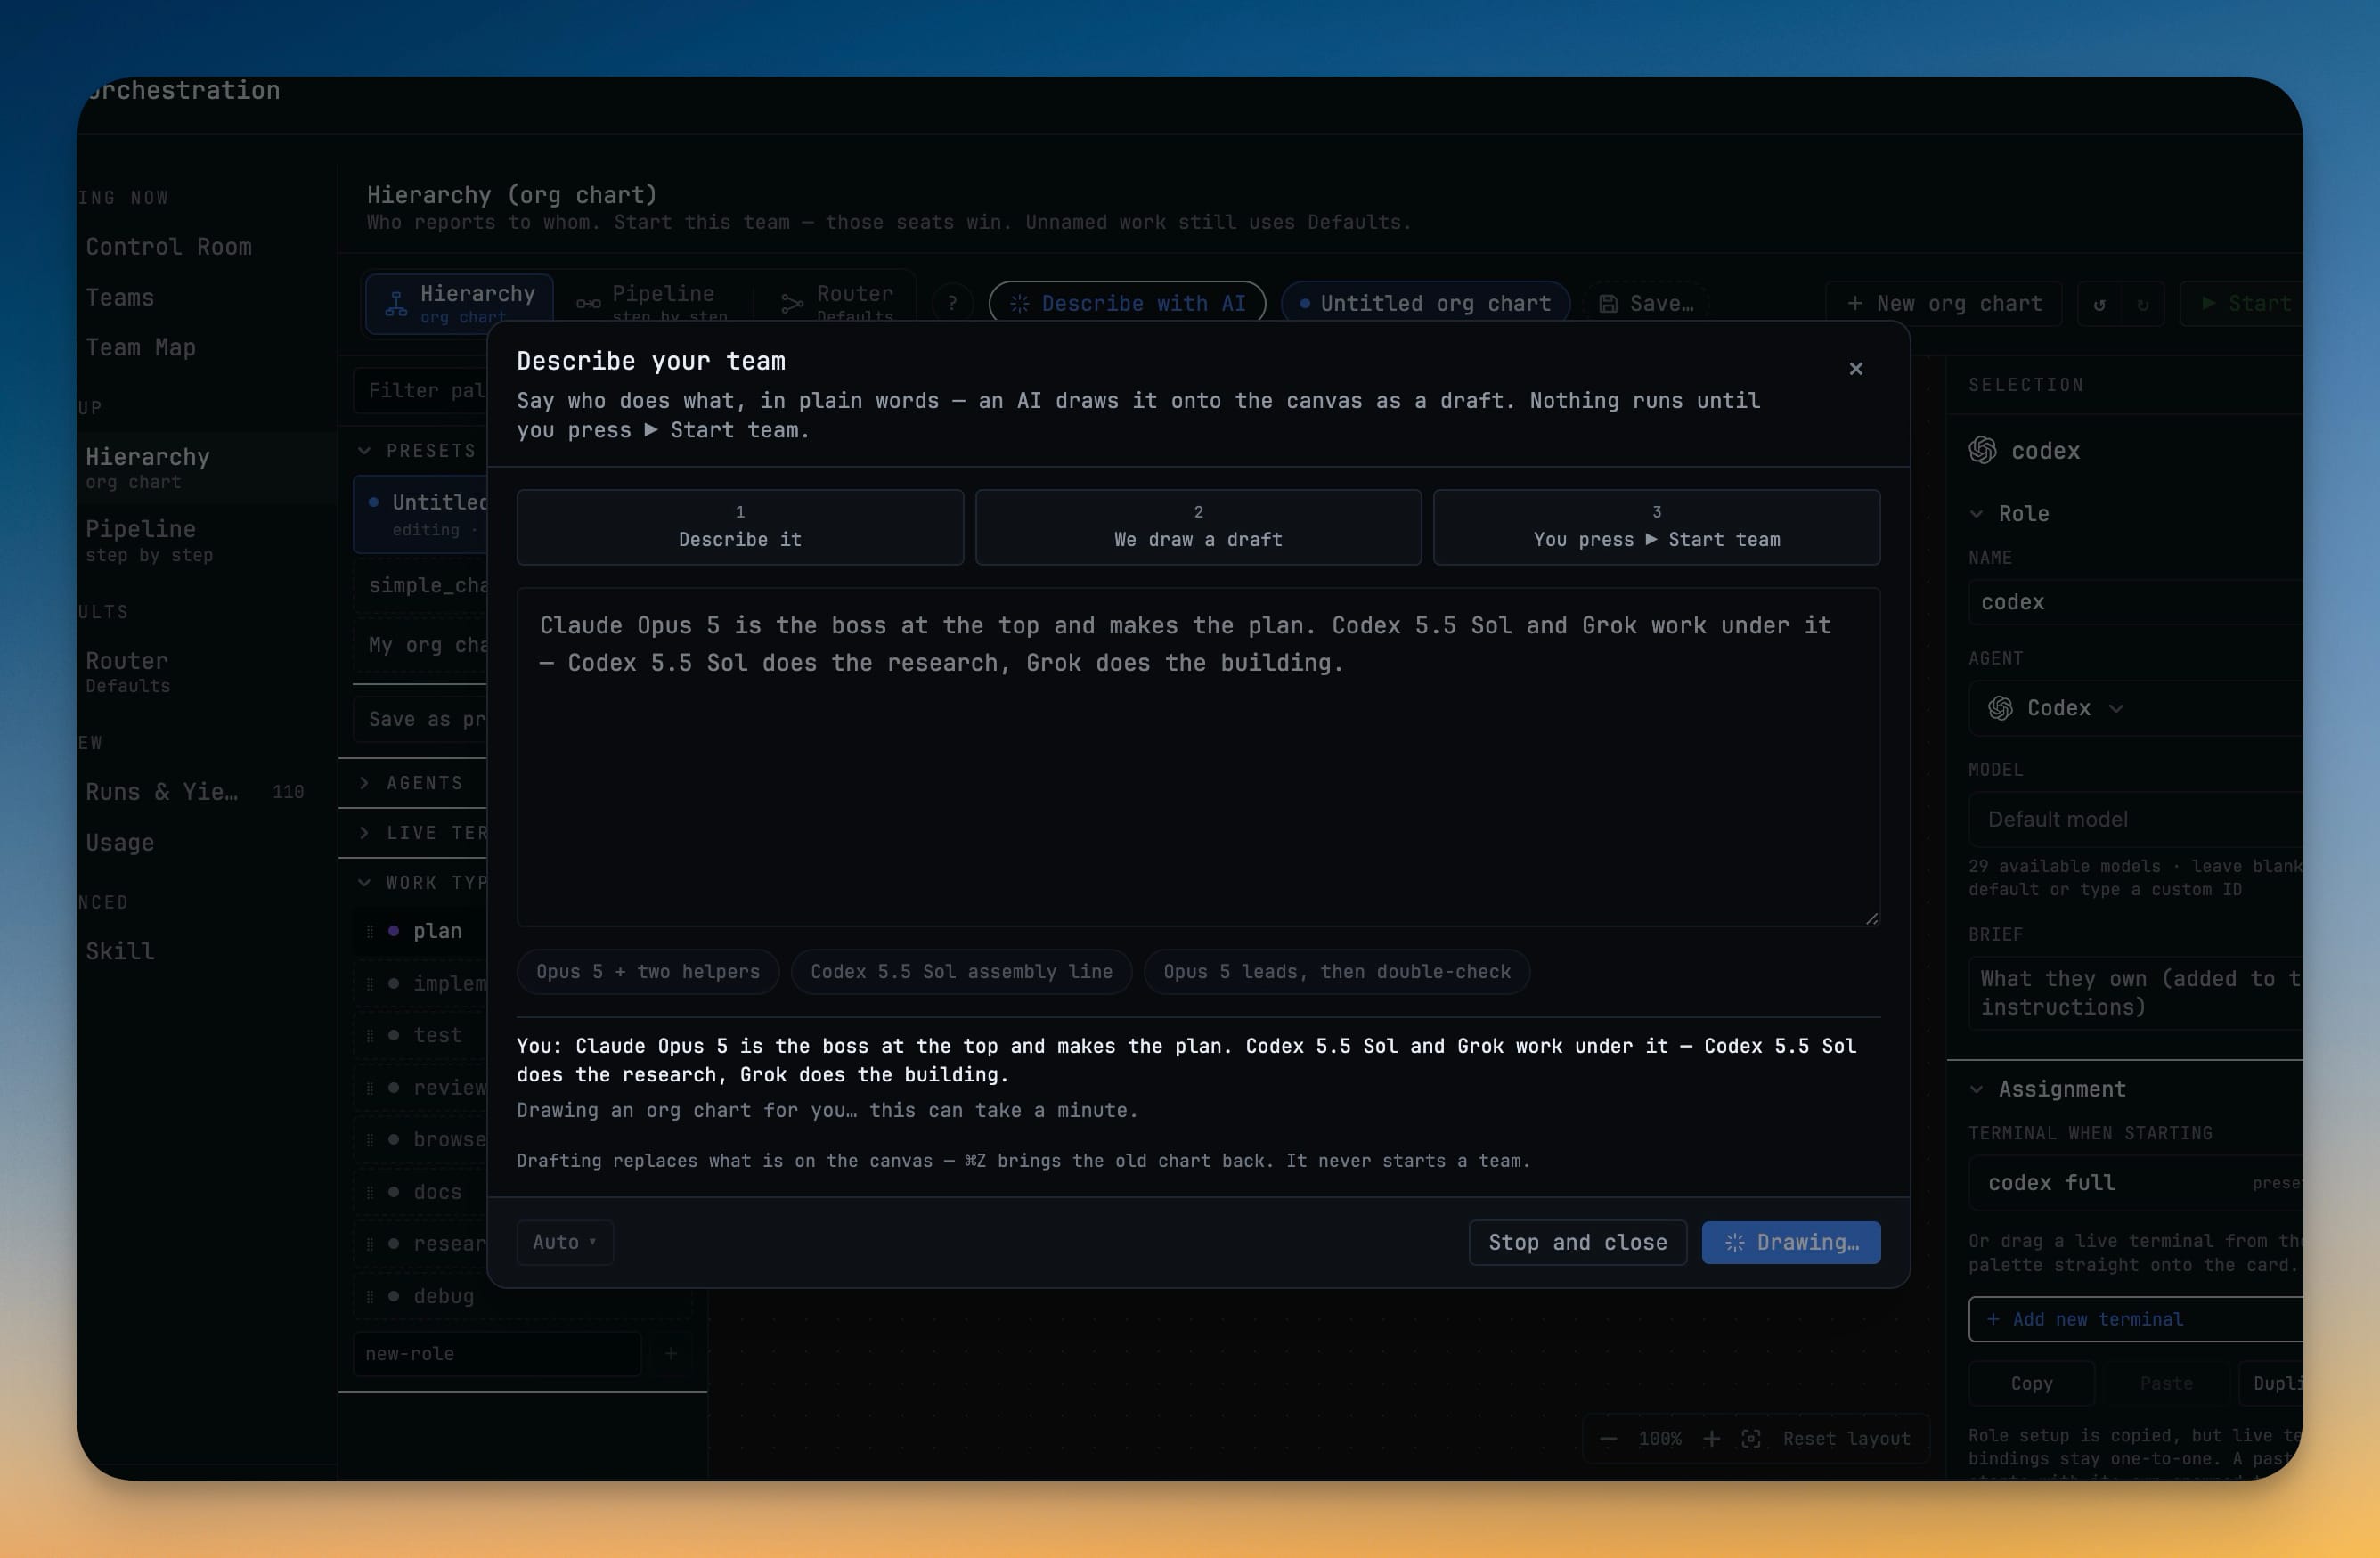
Describe with AI takes a sentence like "Claude is the boss, Codex researches, Grok builds"; a Generate with chip picks which installed CLI drafts it, and ⌘Z brings the old chart back. Drafting never starts a team — only Start team does.
Without 1DevTool
The manual way vs. the 1DevTool way
The Hard Way
The 1DevTool Way
Key Capabilities
Everything included with Charts
Why It Matters
The productivity impact of having ai productivity built into your workspace
Searchable Prompt Library
Every prompt you've ever sent is captured and searchable. Find and reuse your best AI interactions.
Visual AI Communication
Annotate screenshots and embed them in prompts. Show your AI agent exactly what you see.
Session Knowledge Base
AI conversations become searchable history. Find how you solved a similar problem last week.
Power Navigation
Command palette gives you instant access to any feature. Navigate 1DevTool at the speed of thought.
More in AI Productivity
Other features in this category you might find useful
Prompt History
Search prompts and sticky notes from Remote Control while away from the desktop. Switch between This project and All projects, filter prompts by agent or notes by source, copy entries, delete with Operator access, and sync local prompt history.
Resume UI
Browse, search, and resume past AI sessions from Claude Code, Codex, and Gemini CLI — or combine multiple sessions into one.
Combine Sessions
Select sessions from Claude Code, Codex, and Gemini CLI and merge them into a single conversation — giving your next agent the full cross-agent context.
AI Diff Review Panel
Track every file modification any AI agent makes — Claude Code, Codex, Gemini, Amp, custom — and review, accept, or revert their work per file from a dedicated panel with inline diff overlays in the editor.
Ready to boost your workflow?
Download 1DevTool for free and experience Charts along with 321 other features — all in one app.