Resource Manager
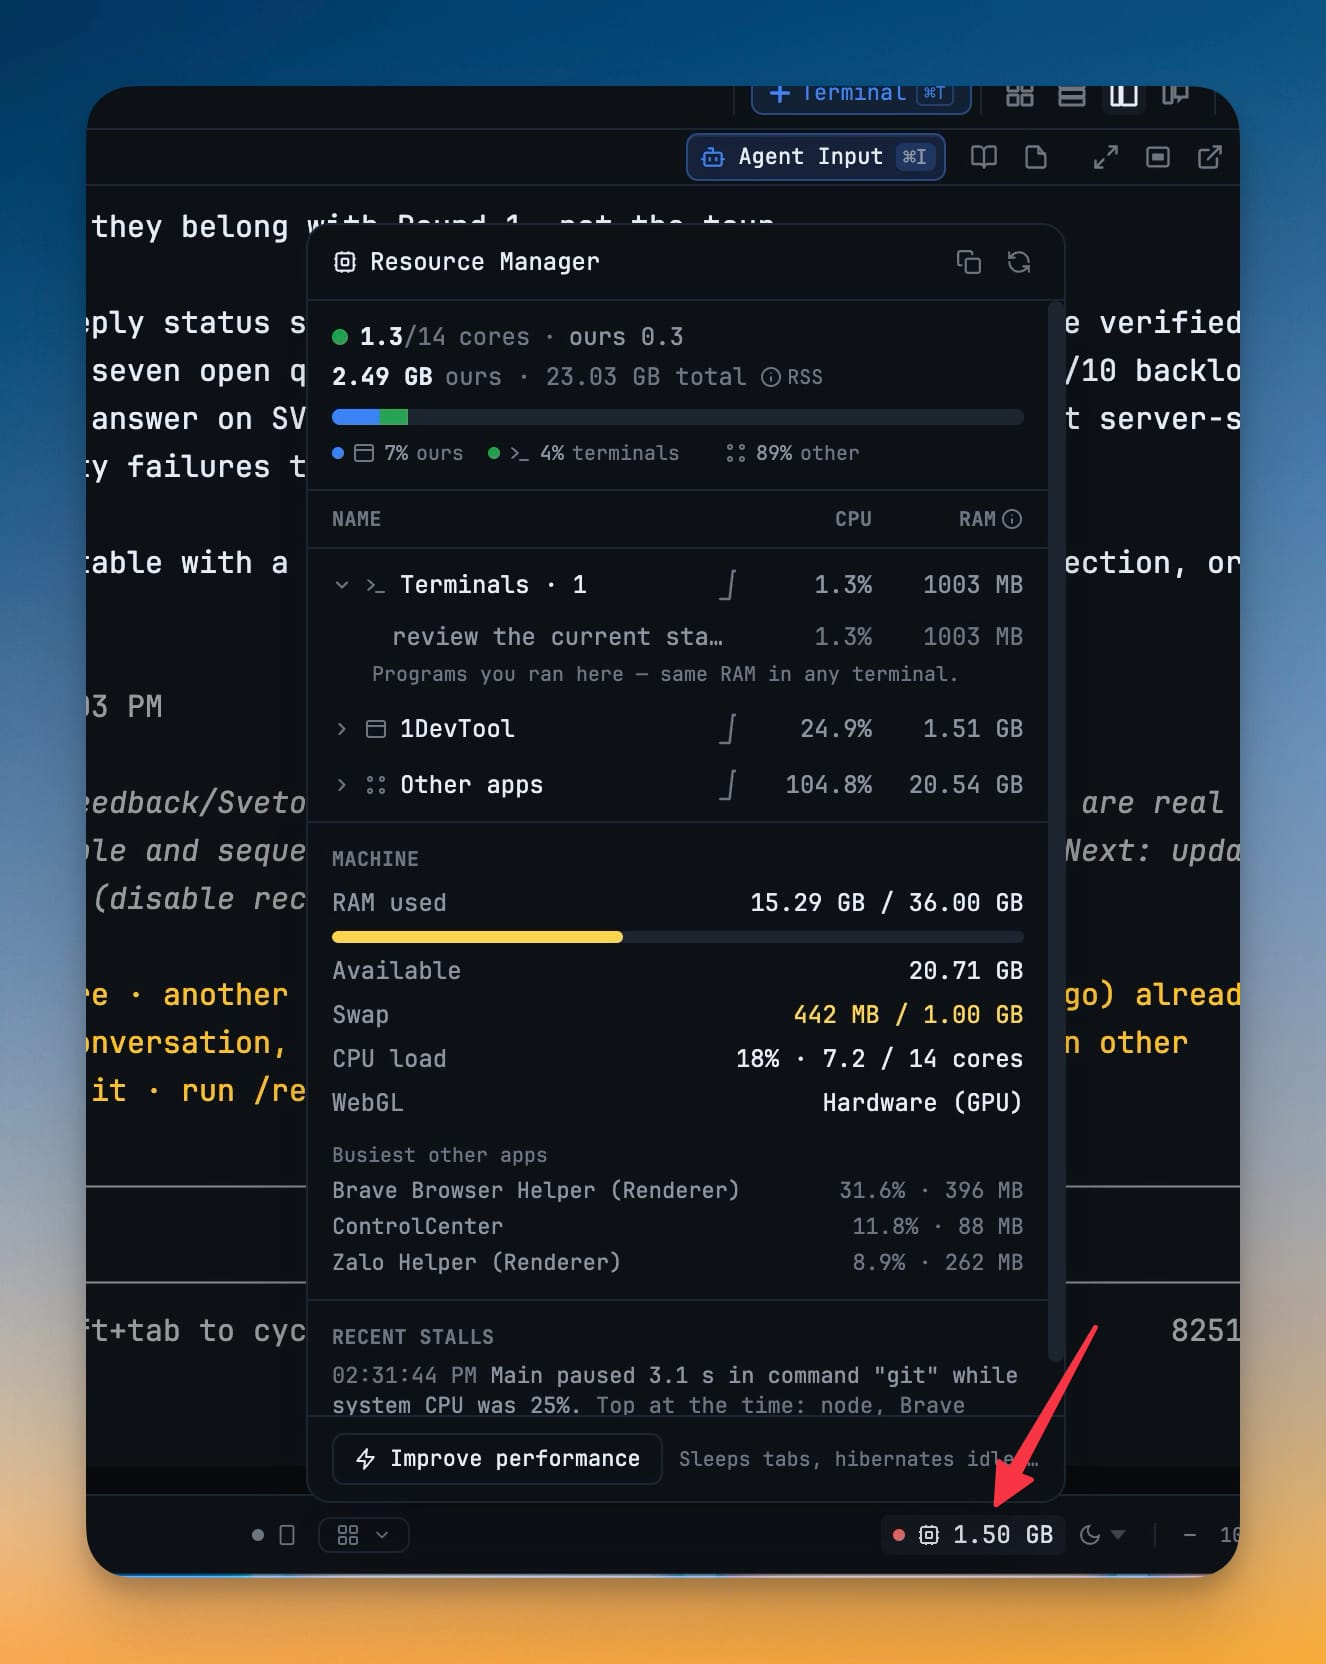
Split your machine's CPU and memory into three honest buckets — 1DevTool, the terminals you started, and other apps — that add up to what your OS reports. An attention strip names the pane that is actually the problem, with Reveal, Pause output, Lower priority, Hibernate and Close one click away.
Why You Need This
How this feature boosts your daily productivity
Your operating system blames 1DevTool for every process a terminal starts. Task Manager nests the shells, `node` and `claude` under our row; Activity Monitor spreads the app across "Helper (Renderer)" rows and gives you no way to map one back to a tab. So the number you see is real and tells you nothing about which of your six panes to close. The Resource Manager names that split instead of hiding it: 1DevTool itself, the terminals you started (with the line “Programs you ran here — same RAM in any terminal”, because those processes cost the same in any terminal app), and everything else on the machine — three buckets that add up to what your OS reports. Expand one and every terminal is listed the way its tab is, with its own CPU and RSS. When a pane pins the CPU across two consecutive samples or starts flooding output, it gets an attention row naming the reason — “62% CPU”, “8.4 MB/s output · throttled” — with **Reveal** to bring that exact pane forward and a **⋯** menu carrying **Pause output**, **Lower priority**, **Hibernate** and **Close**. Underneath sit **RAM used**, **Available**, **Swap**, **CPU load** against your real core count, whether **WebGL** is on hardware, and a **Busiest other apps** list that names the browser eating 31% instead of letting you blame the workspace. **Recent stalls** shows any freeze in plain words, and **Copy diagnostic report** puts all of it on your clipboard as Markdown, ready to paste into a bug report. One footer button, **Improve performance**, sleeps inactive tabs, hibernates idle agents and clears buffers in a single step.
How It Works
Get started in 4 simple steps
Click the memory reading in the status bar
The number you have been ignoring opens the Resource Manager on a summary: cores in use against the cores you have, resident memory that is ours against the machine total, and a bar splitting that memory three ways.
Read the three buckets
1DevTool itself, the terminals you started, and other apps on the machine — and the three add up to what your OS reports. Each carries a line explaining what it really contains: "Programs you ran here — same RAM in any terminal. Task Manager nests them under 1DevTool."
Expand the bucket you suspect
Every terminal is listed the way its tab is, with its own CPU and RSS, so a runaway agent is a tab you can go and look at rather than an anonymous process id in Activity Monitor.
Act on the attention row
A pane pinning the CPU or flooding output gets its own row naming the reason — "62% CPU", "8.4 MB/s output · throttled" — with Reveal to bring it forward, and Pause output, Lower priority, Hibernate or Close behind its ⋯.
Copy the evidence, or free memory in one step
Copy diagnostic report puts the buckets, top consumers, GPU rendering status and recent stalls on your clipboard as Markdown. Improve performance sleeps inactive tabs, hibernates idle agents and clears buffers.
Without 1DevTool
The manual way vs. the 1DevTool way
The Hard Way
The 1DevTool Way
Key Capabilities
Everything included with Resource Manager
Why It Matters
The productivity impact of having project management built into your workspace
Instant Project Switching
Switch between projects in one click with complete state restoration. No more 5-minute setup rituals.
Visual Organization
Color-coded projects, file type icons, and layout presets keep your workspace organized and recognizable.
Smart File Navigation
.gitignore-aware filtering, instant search, and context menus make finding and opening files effortless.
Workspace Memory
Every project remembers its terminals, open files, database connections, and layout. Pick up exactly where you left off.
More in Project Management
Other features in this category you might find useful
Multi-Project Workspace
Work on multiple projects simultaneously with instant switching. Entire workspace state is preserved per project.
Smart File Explorer
Real-time file tree with type icons, .gitignore filtering, search, and right-click context menus.
Per-Project Code Intelligence
Spawn real typescript-language-server, gopls, pyright, rust-analyzer, clangd, solargraph, intelephense, or sourcekit-lsp for the projects you opt into — with project-aware errors and zero false positives.
Color-Coded Projects
Assign accent colors to each project for instant visual identification across your workspace.
Ready to boost your workflow?
Download 1DevTool for free and experience Resource Manager along with 326 other features — all in one app.