Analytics
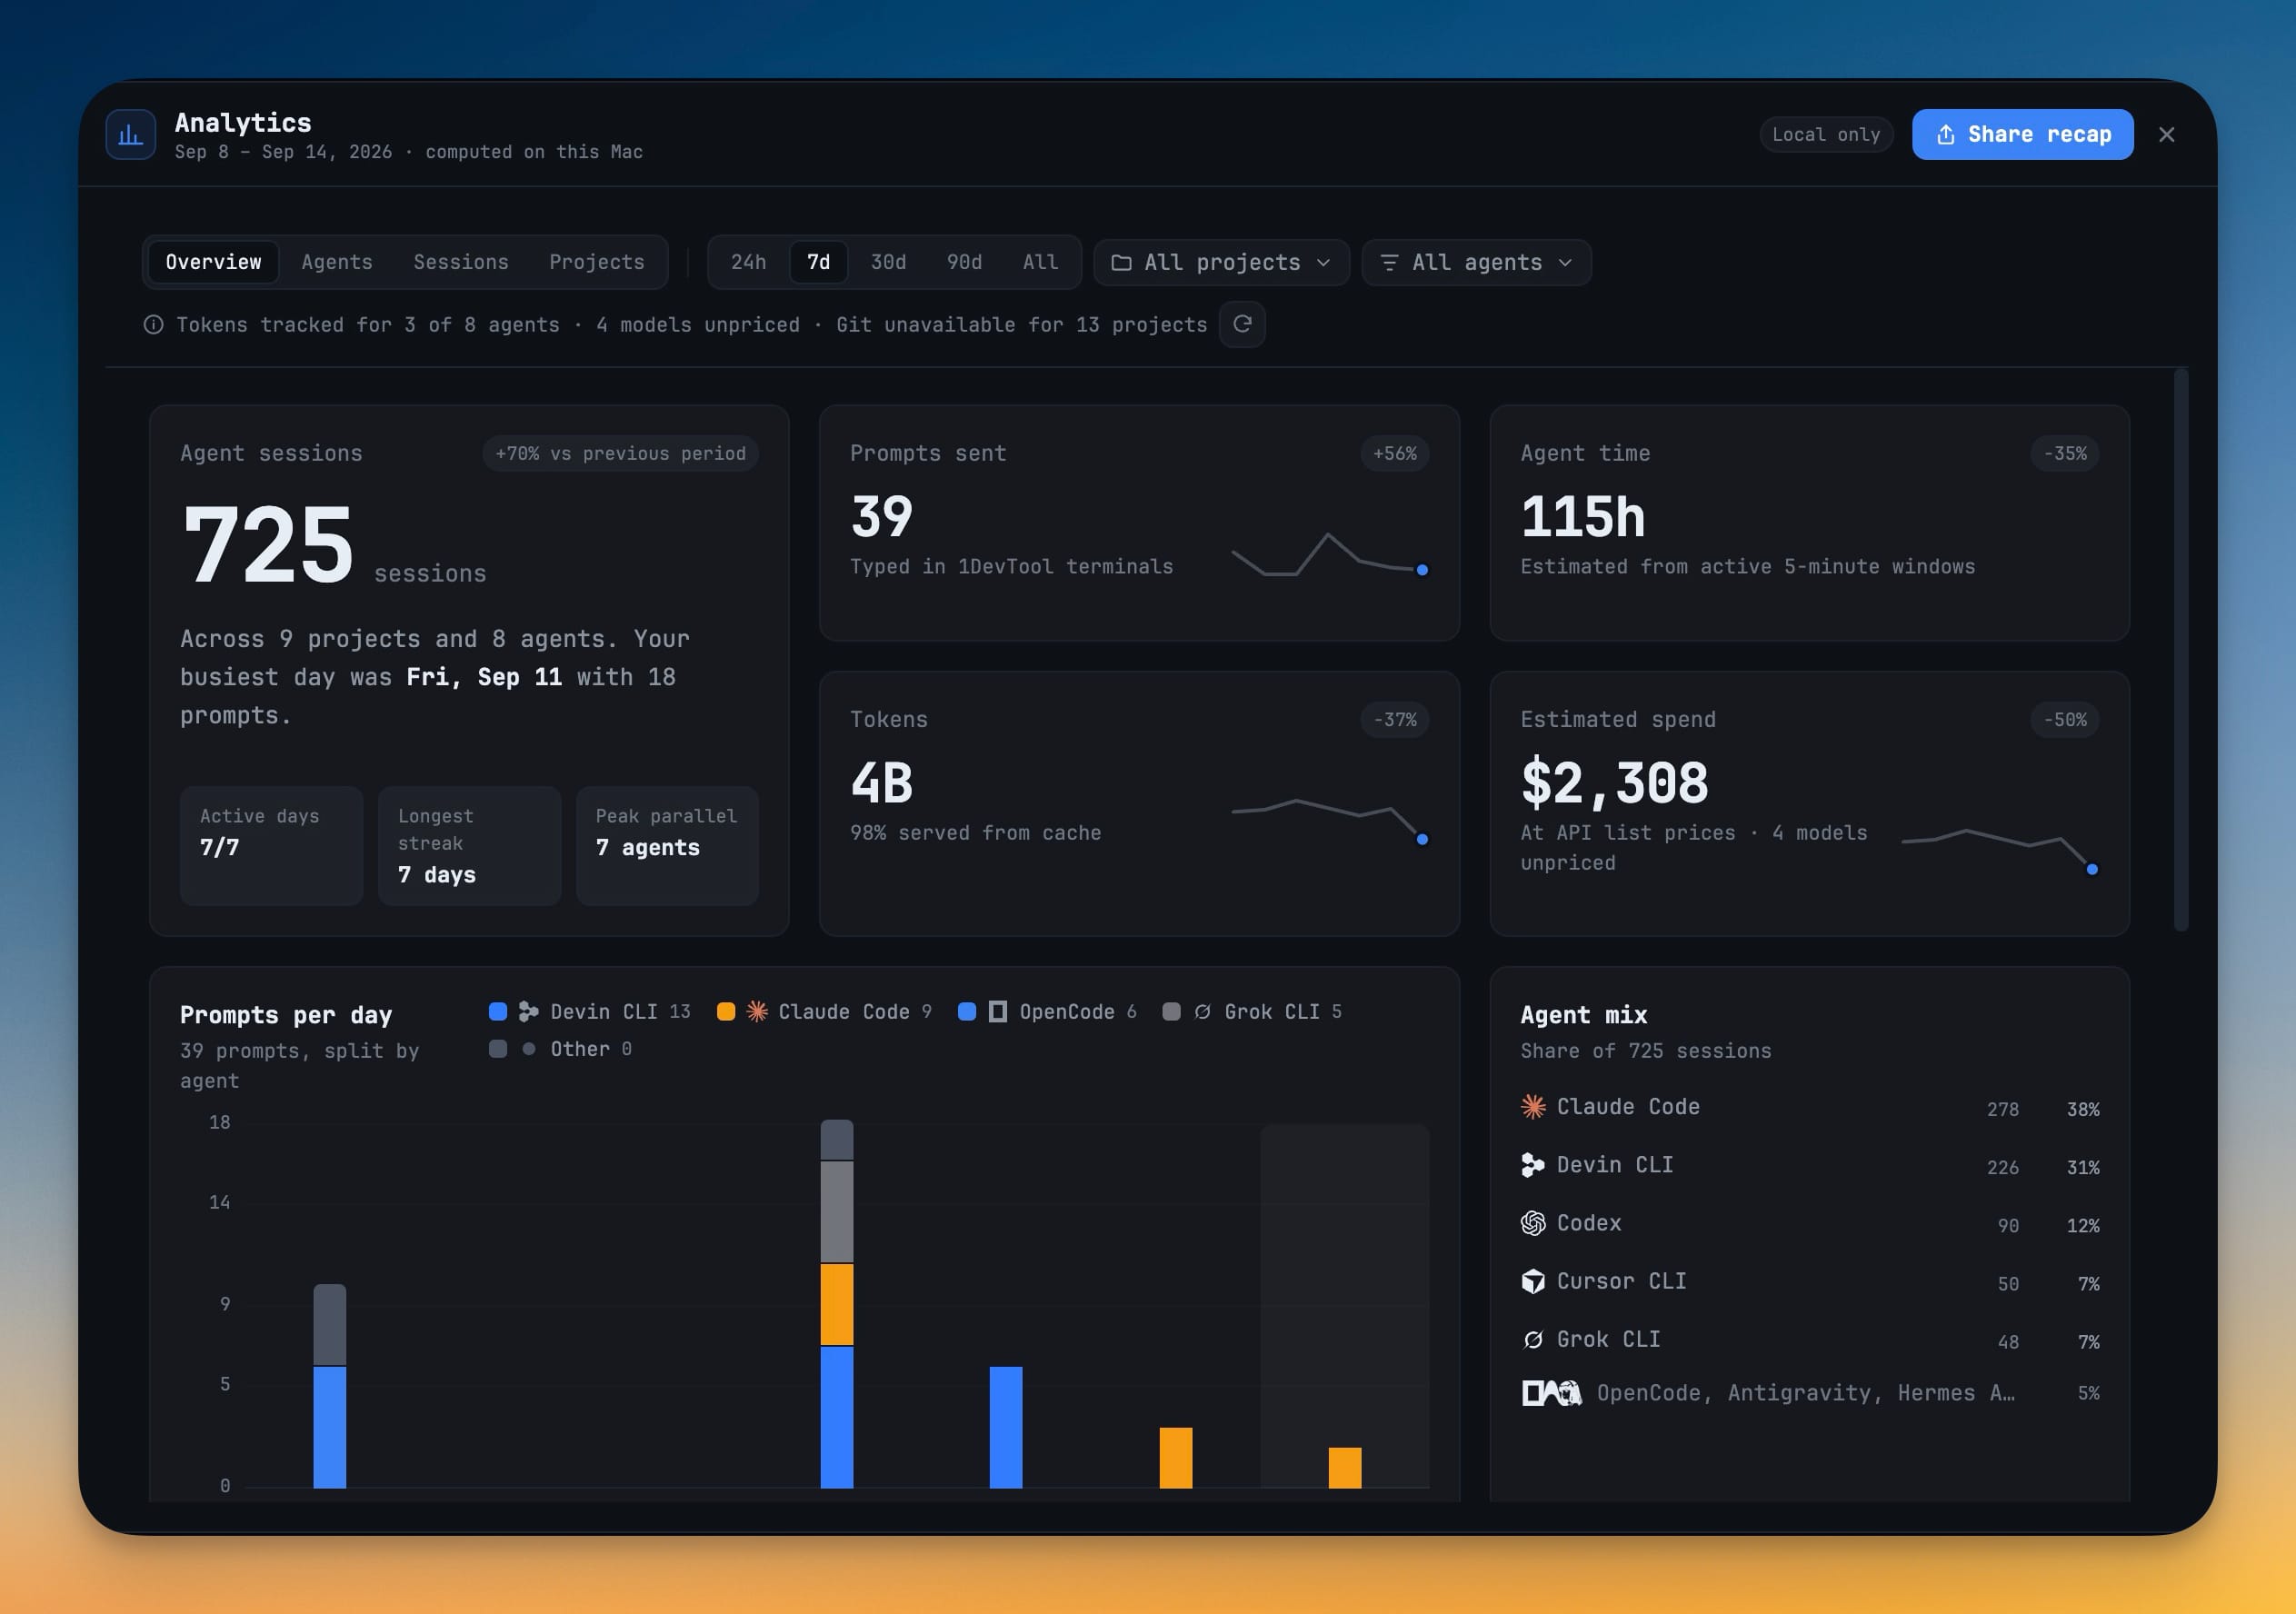
See what your AI agents actually did — sessions, prompts, agent time, tokens and estimated spend across every coding CLI you run, built from the session logs, prompt history and git already on your machine. Nothing is uploaded, estimates are labelled as estimates, and coverage gaps are shown instead of zeros.
More Screenshots
Click any image to zoom in
Why You Need This
How this feature boosts your daily productivity
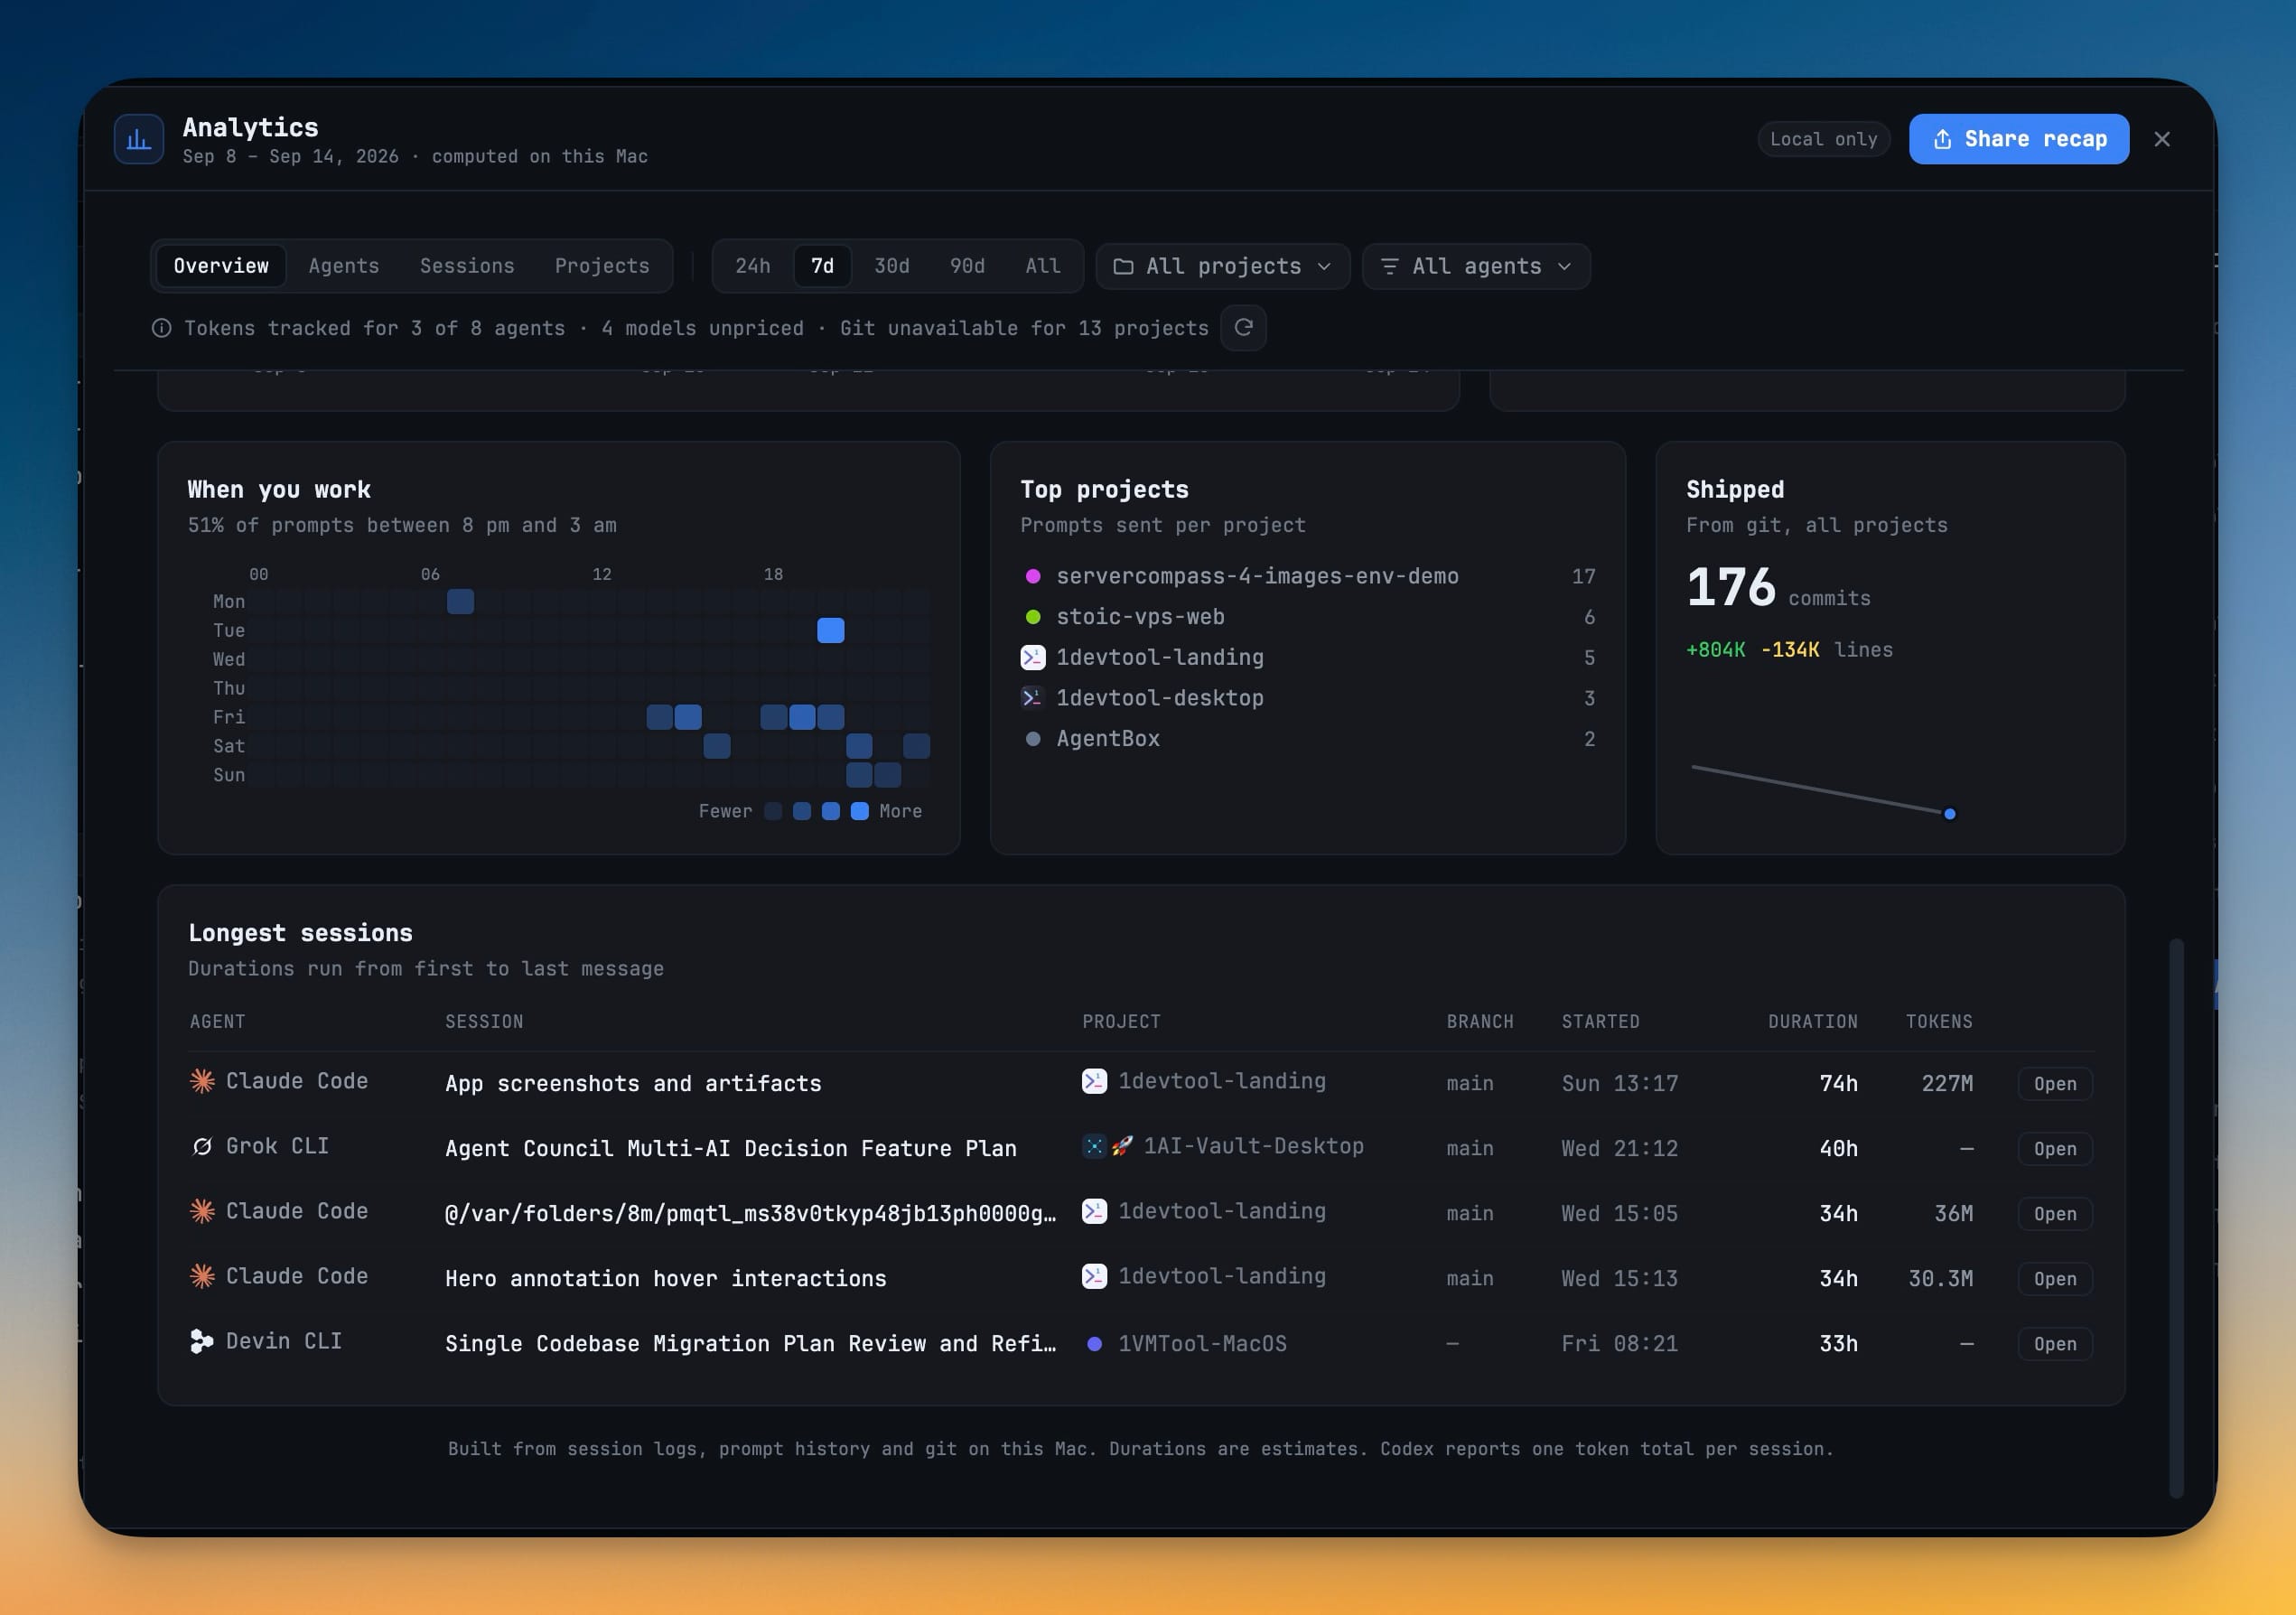
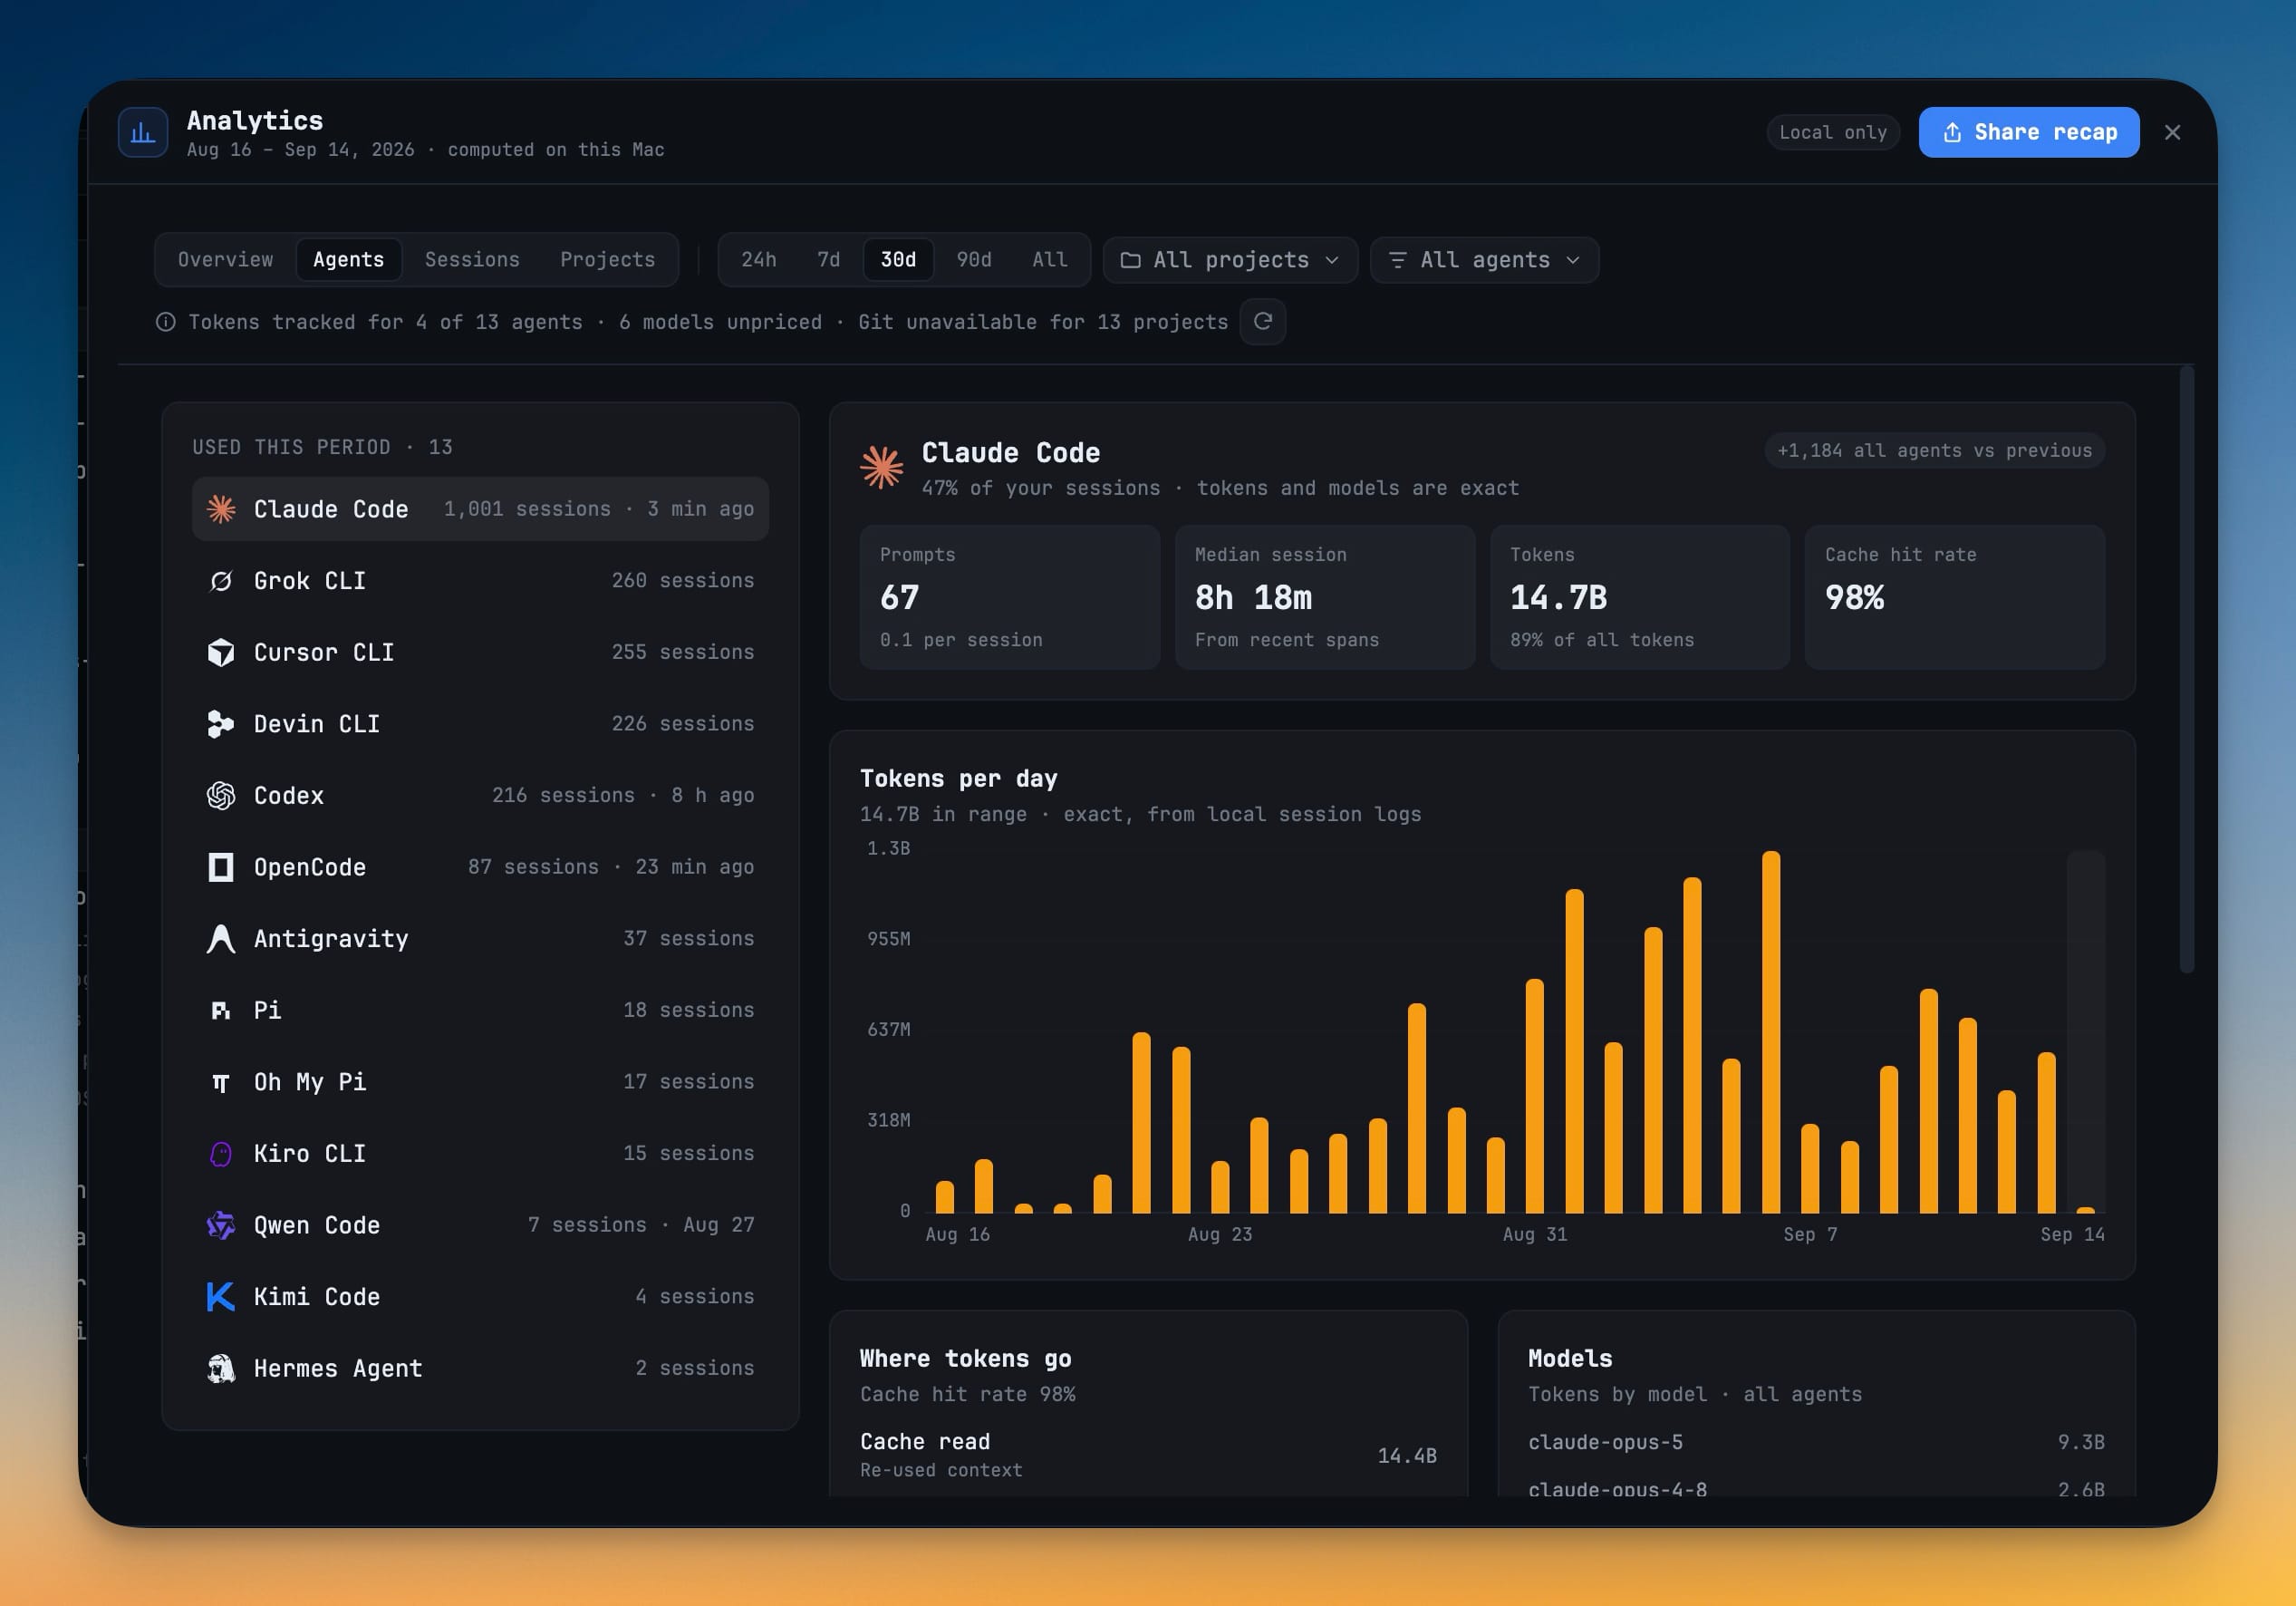
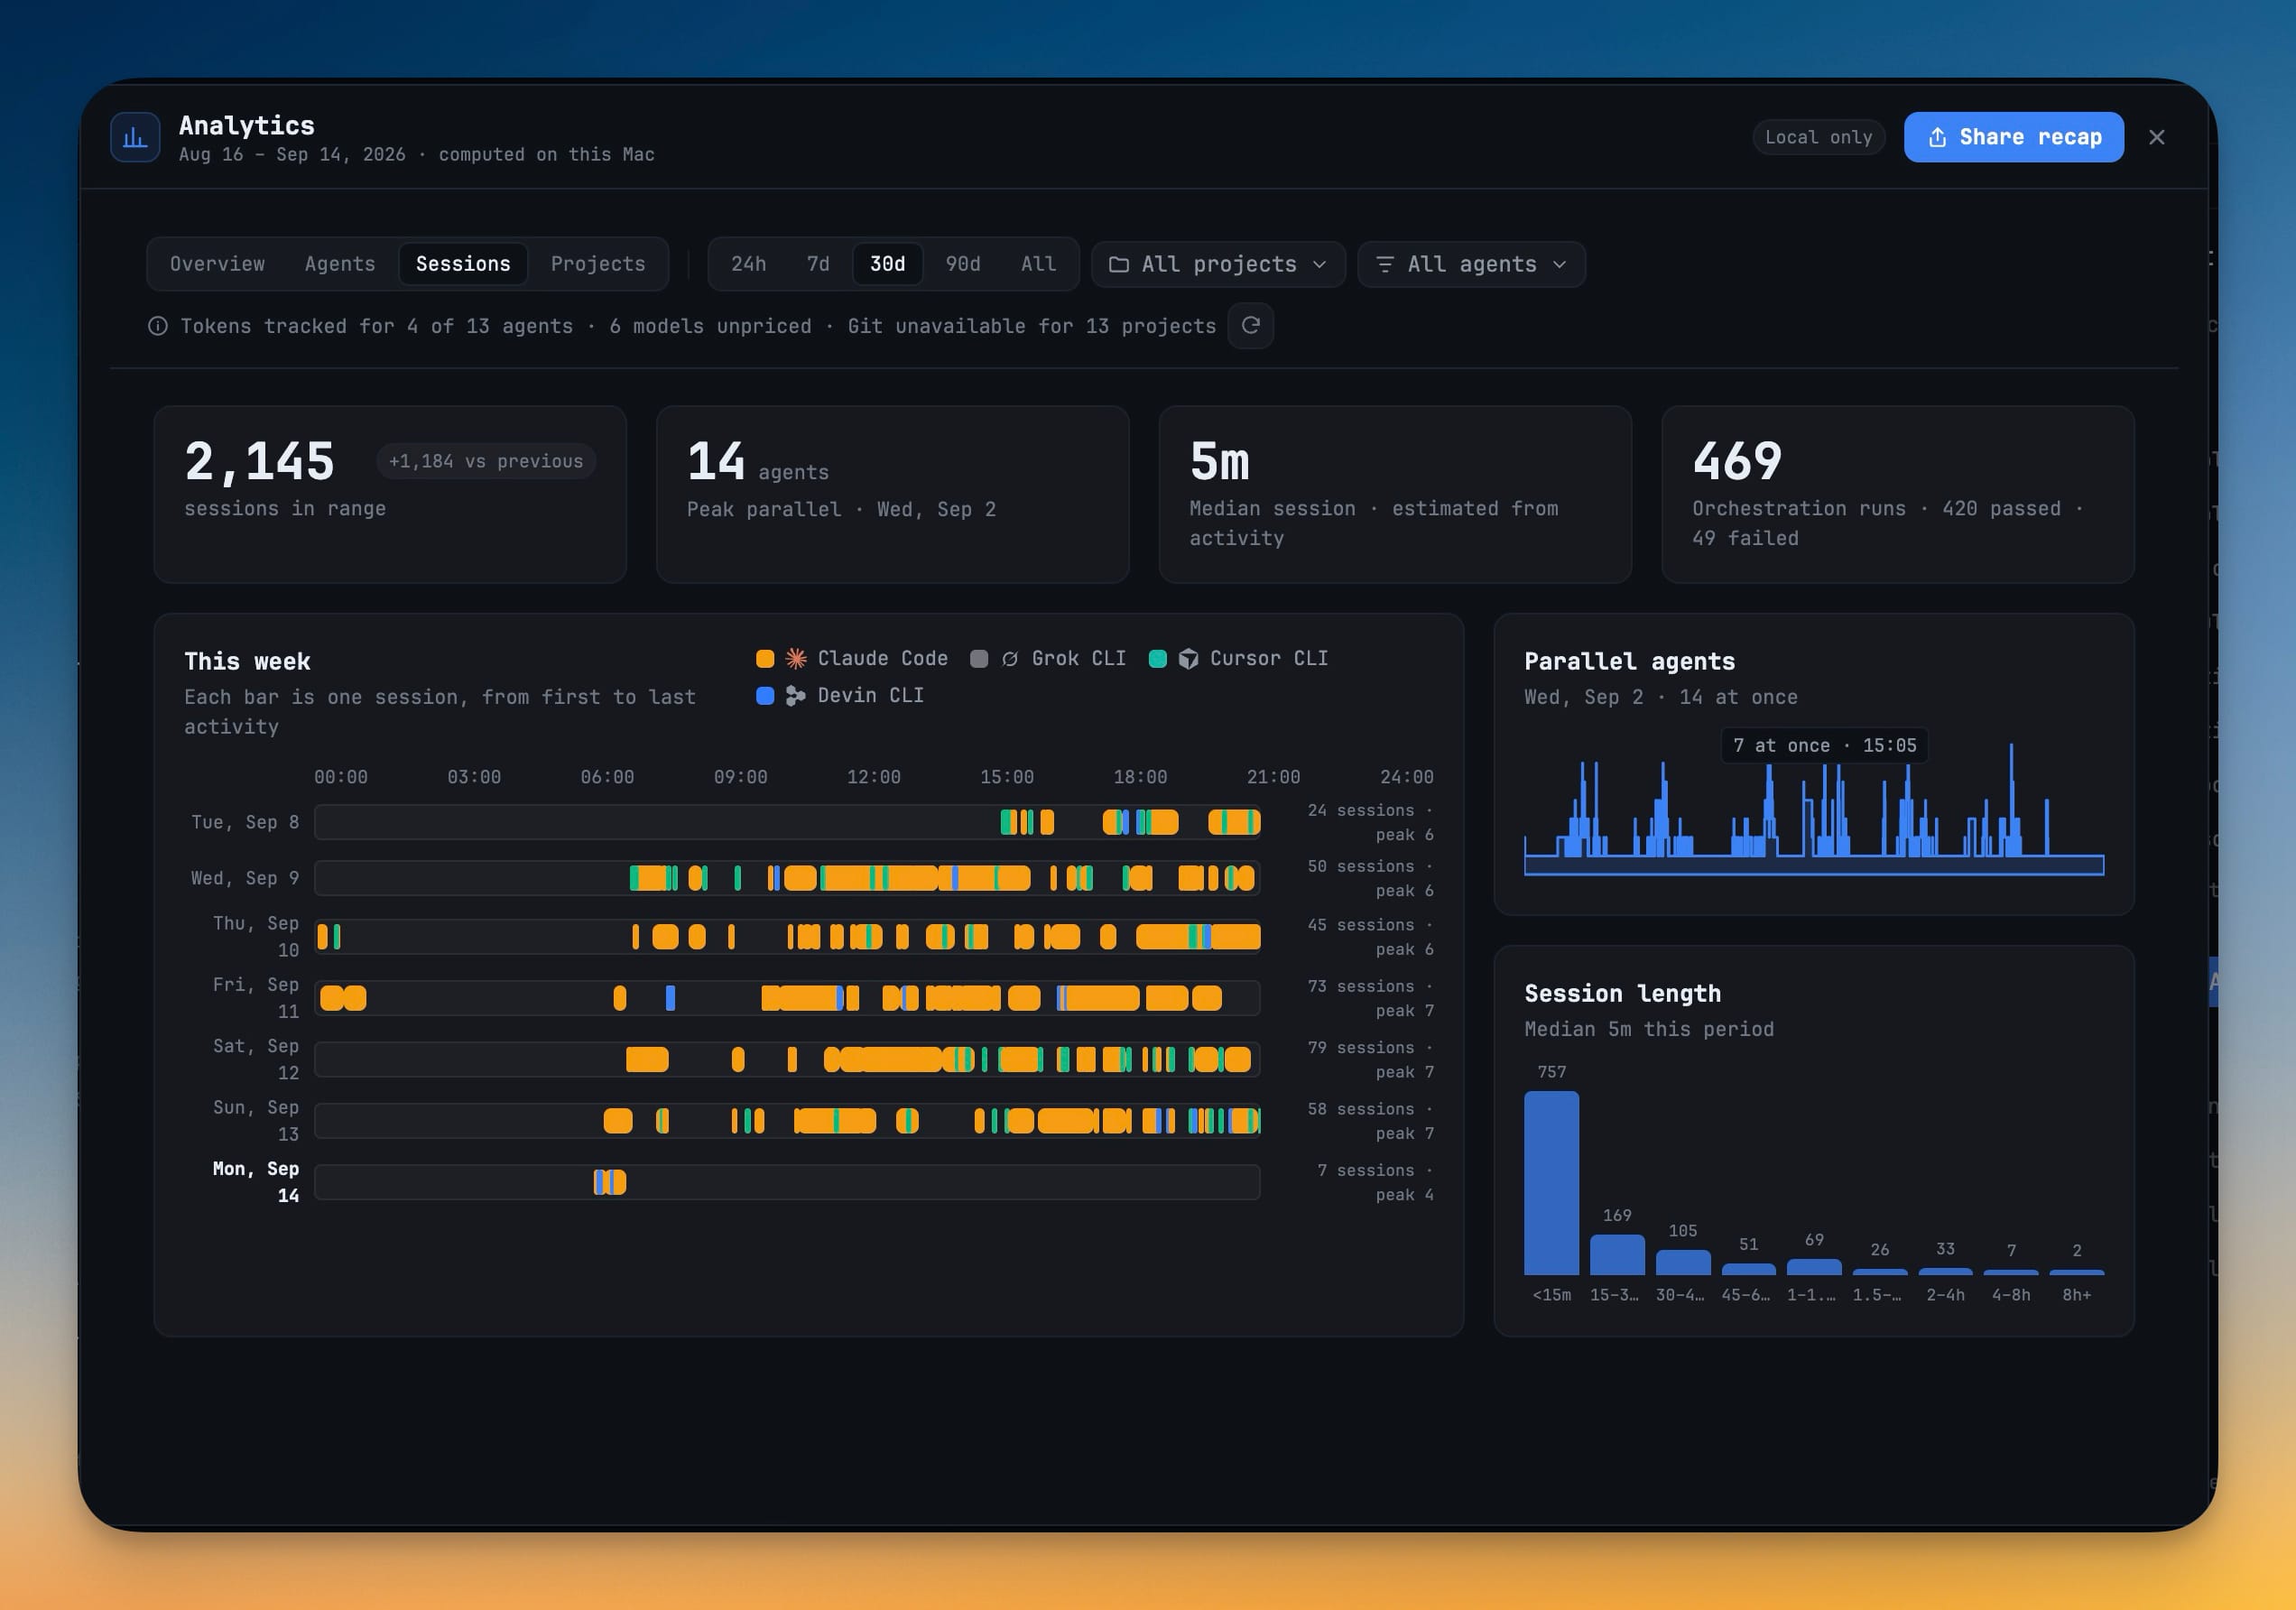
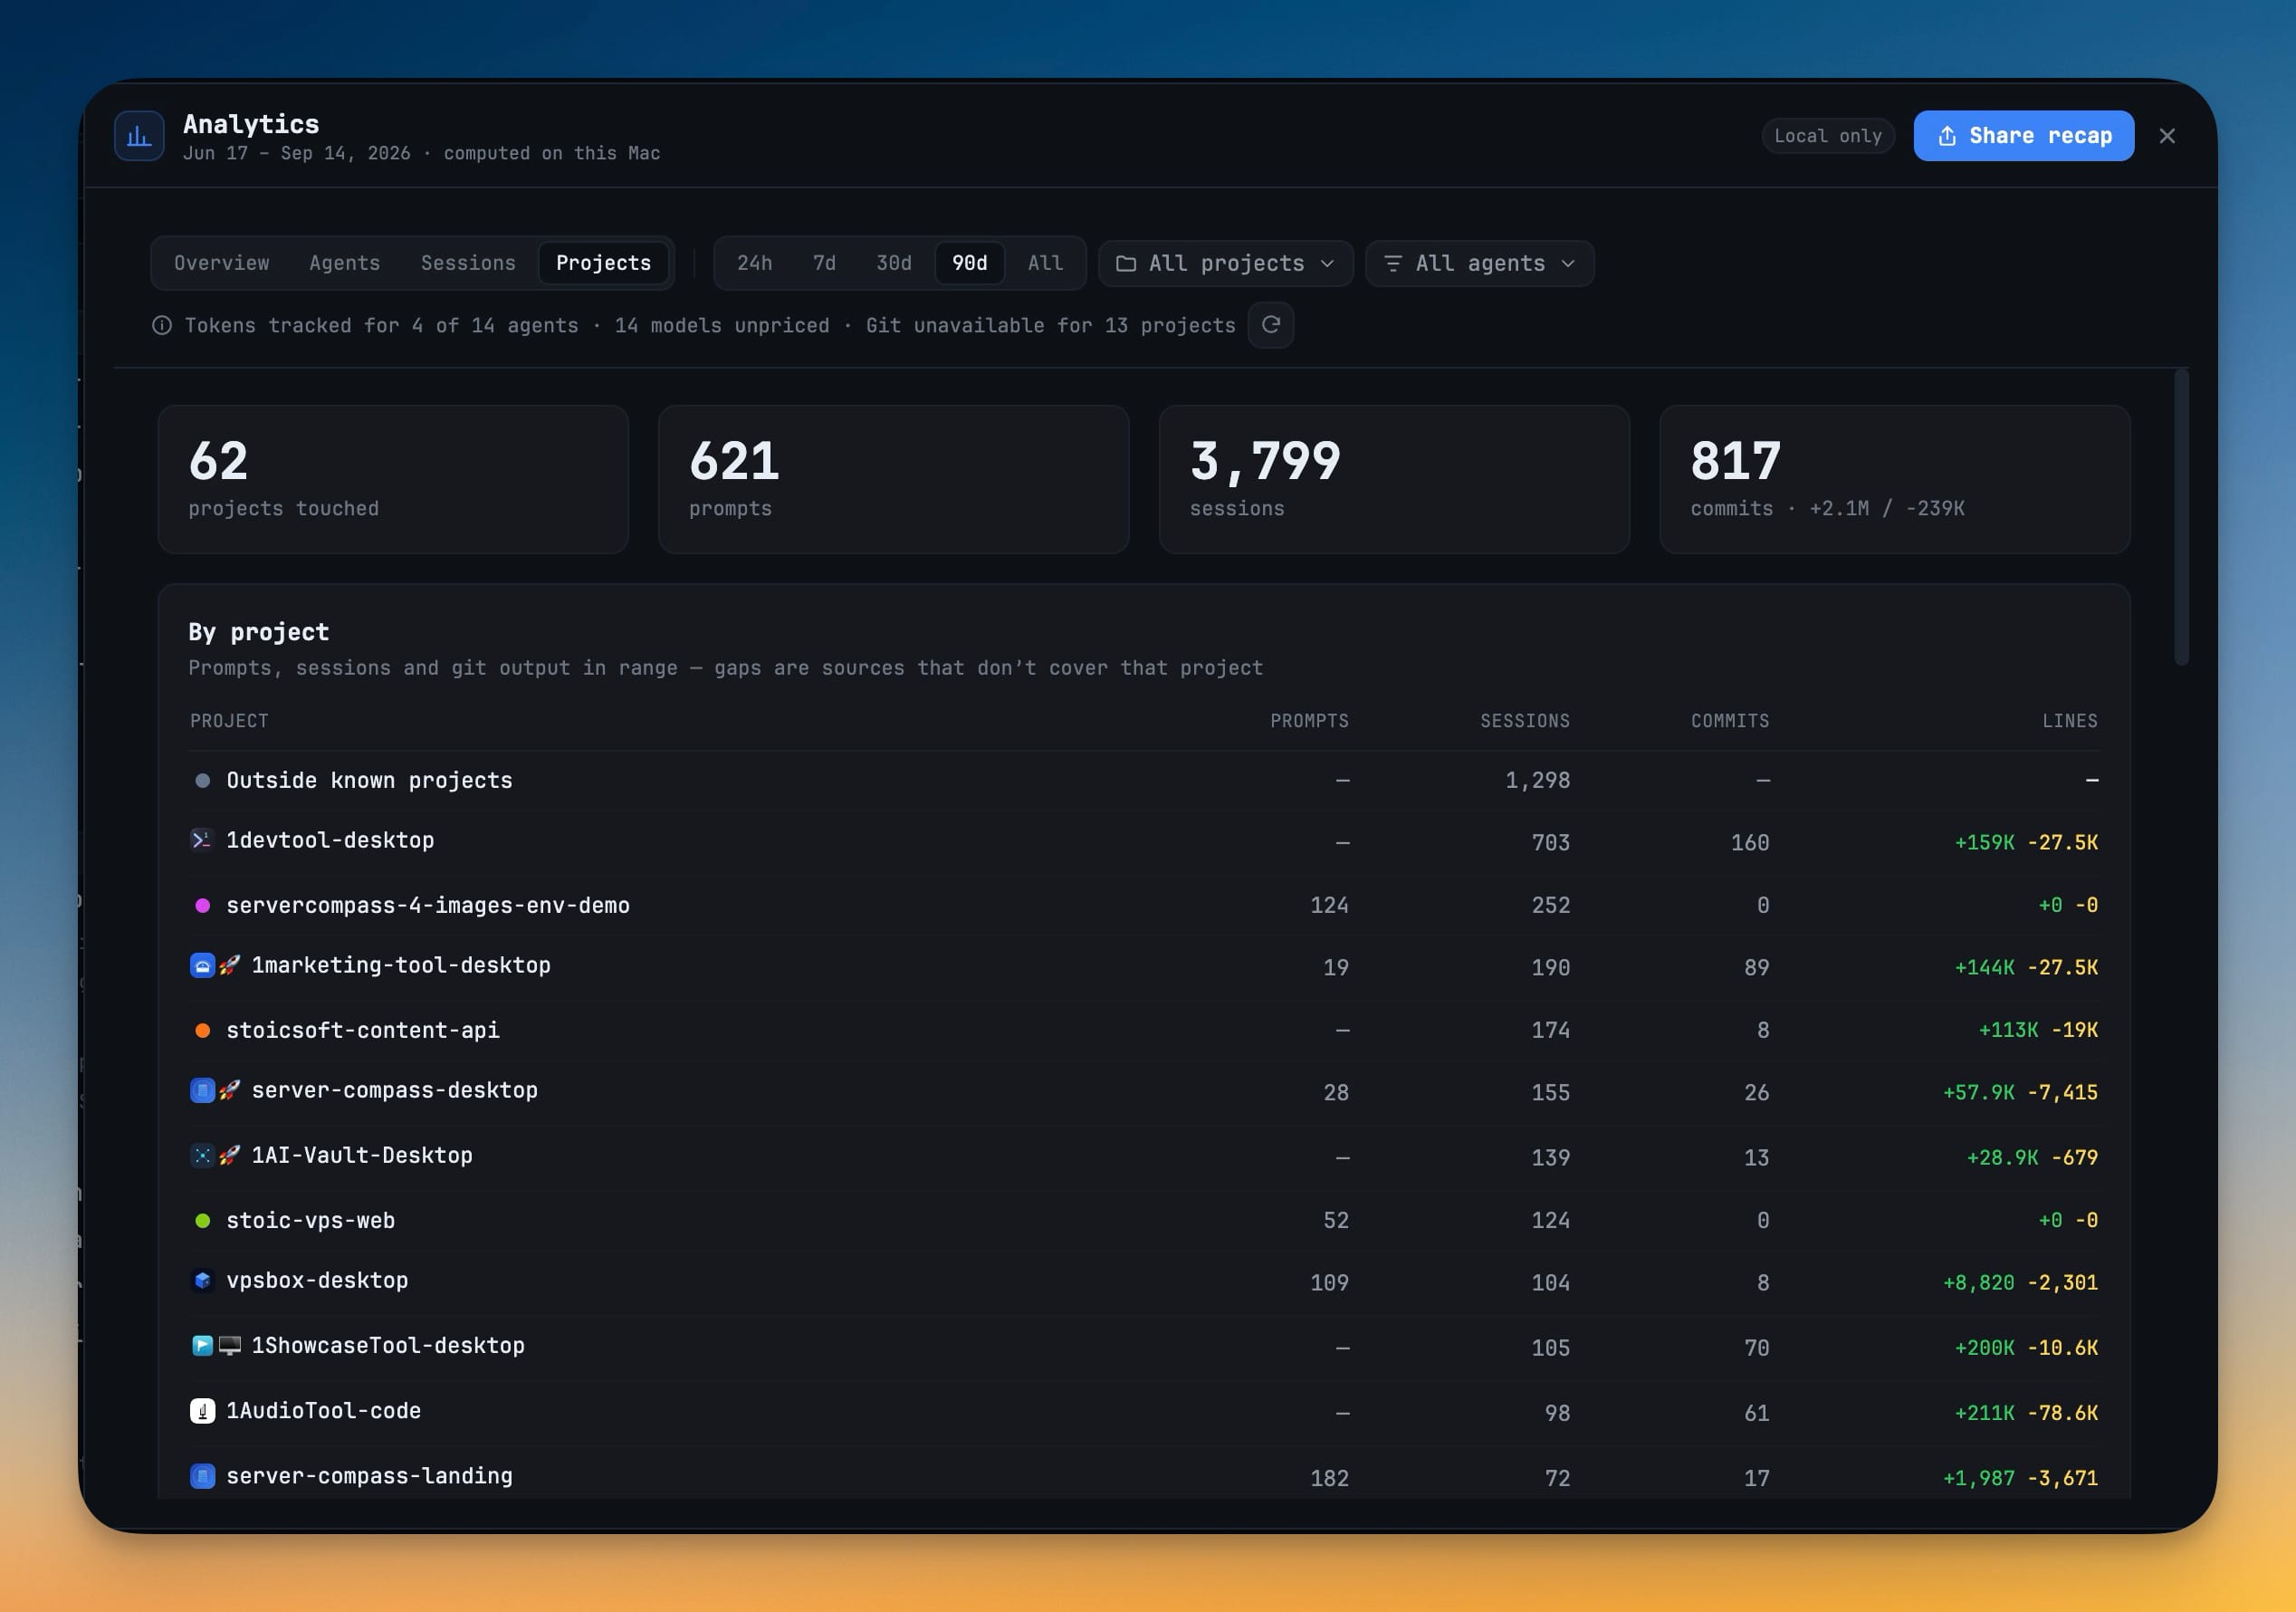
Running several coding agents leaves a trail in half a dozen formats — JSONL token logs, per-CLI session stores, prompt history, git — and none of them answer the questions you actually have: how much did the agents do this week, which one burned the tokens, were they really running in parallel, and what would it have cost at list prices. Analytics reads that trail locally and lays it out across four tabs. **Overview** gives you agent sessions against the previous period, prompts sent, agent time estimated from active 5-minute windows, tokens with the cache share, estimated spend, a weekday-by-hour punchcard, top projects, what you shipped in git and your longest sessions. **Agents** breaks tokens down per CLI into cache read, cache write, output and input, and lists the models you run with a warning on any model that has no known price. **Sessions** draws the week as a timeline with a parallel-agents chart and your orchestration runs passed and failed, and **Projects** puts prompts, sessions, commits and lines side by side. Scope any of it to 24h, 7d, 30d, 90d or All, and to one project or one agent. Open it with ⌘⇧A, from Navigate → Analytics…, or from the Command Palette.
How It Works
Get started in 4 simple steps
Open Analytics
Press ⌘⇧A (Ctrl+Shift+A on Windows and Linux), pick Analytics… from the Navigate menu, or run Open Analytics from the Command Palette.
Pick a range and a scope
Choose 24h, 7d, 30d, 90d or All, then narrow it with All projects and All agents. Long ranges roll up from days to weeks to months.
Read the four tabs
Overview sums up sessions, prompts, agent time, tokens and spend; Agents, Sessions and Projects break the same period down by CLI, by timeline and by repo.
Check the coverage line
When a source is missing it says so — Tokens tracked for 3 of 8 agents, models unpriced, Git unavailable — instead of drawing a zero.
Without 1DevTool
The manual way vs. the 1DevTool way
The Hard Way
The 1DevTool Way
Key Capabilities
Everything included with Analytics
Why It Matters
The productivity impact of having ai productivity built into your workspace
Numbers Instead Of A Hunch
“I ran a lot of agents this week” becomes sessions, agent time, tokens and spend you can actually compare against last week.
See Where The Tokens Go
The per-agent cache, output and model breakdown shows which CLI and which model carry the volume before a bill does.
Honest About Its Gaps
Coverage is spelled out and missing data is omitted, so a small number never hides a source that simply was not tracked.
Stays On Your Machine
Everything is computed from local logs, prompt history and git; the dialog computes nothing while it is closed.
More in AI Productivity
Other features in this category you might find useful
Prompt History
Search prompts and sticky notes from Remote Control while away from the desktop. Switch between This project and All projects, filter prompts by agent or notes by source, copy entries, delete with Operator access, and sync local prompt history.
Resume UI
Browse, search, and resume past AI sessions from Claude Code, Codex, and Gemini CLI — or combine multiple sessions into one.
Combine Sessions
Select sessions from Claude Code, Codex, and Gemini CLI and merge them into a single conversation — giving your next agent the full cross-agent context.
AI Diff Review Panel
Track every file modification any AI agent makes — Claude Code, Codex, Gemini, Amp, custom — and review, accept, or revert their work per file from a dedicated panel with inline diff overlays in the editor.
Ready to boost your workflow?
Download 1DevTool for free and experience Analytics along with 305 other features — all in one app.