Stall Diagnostics
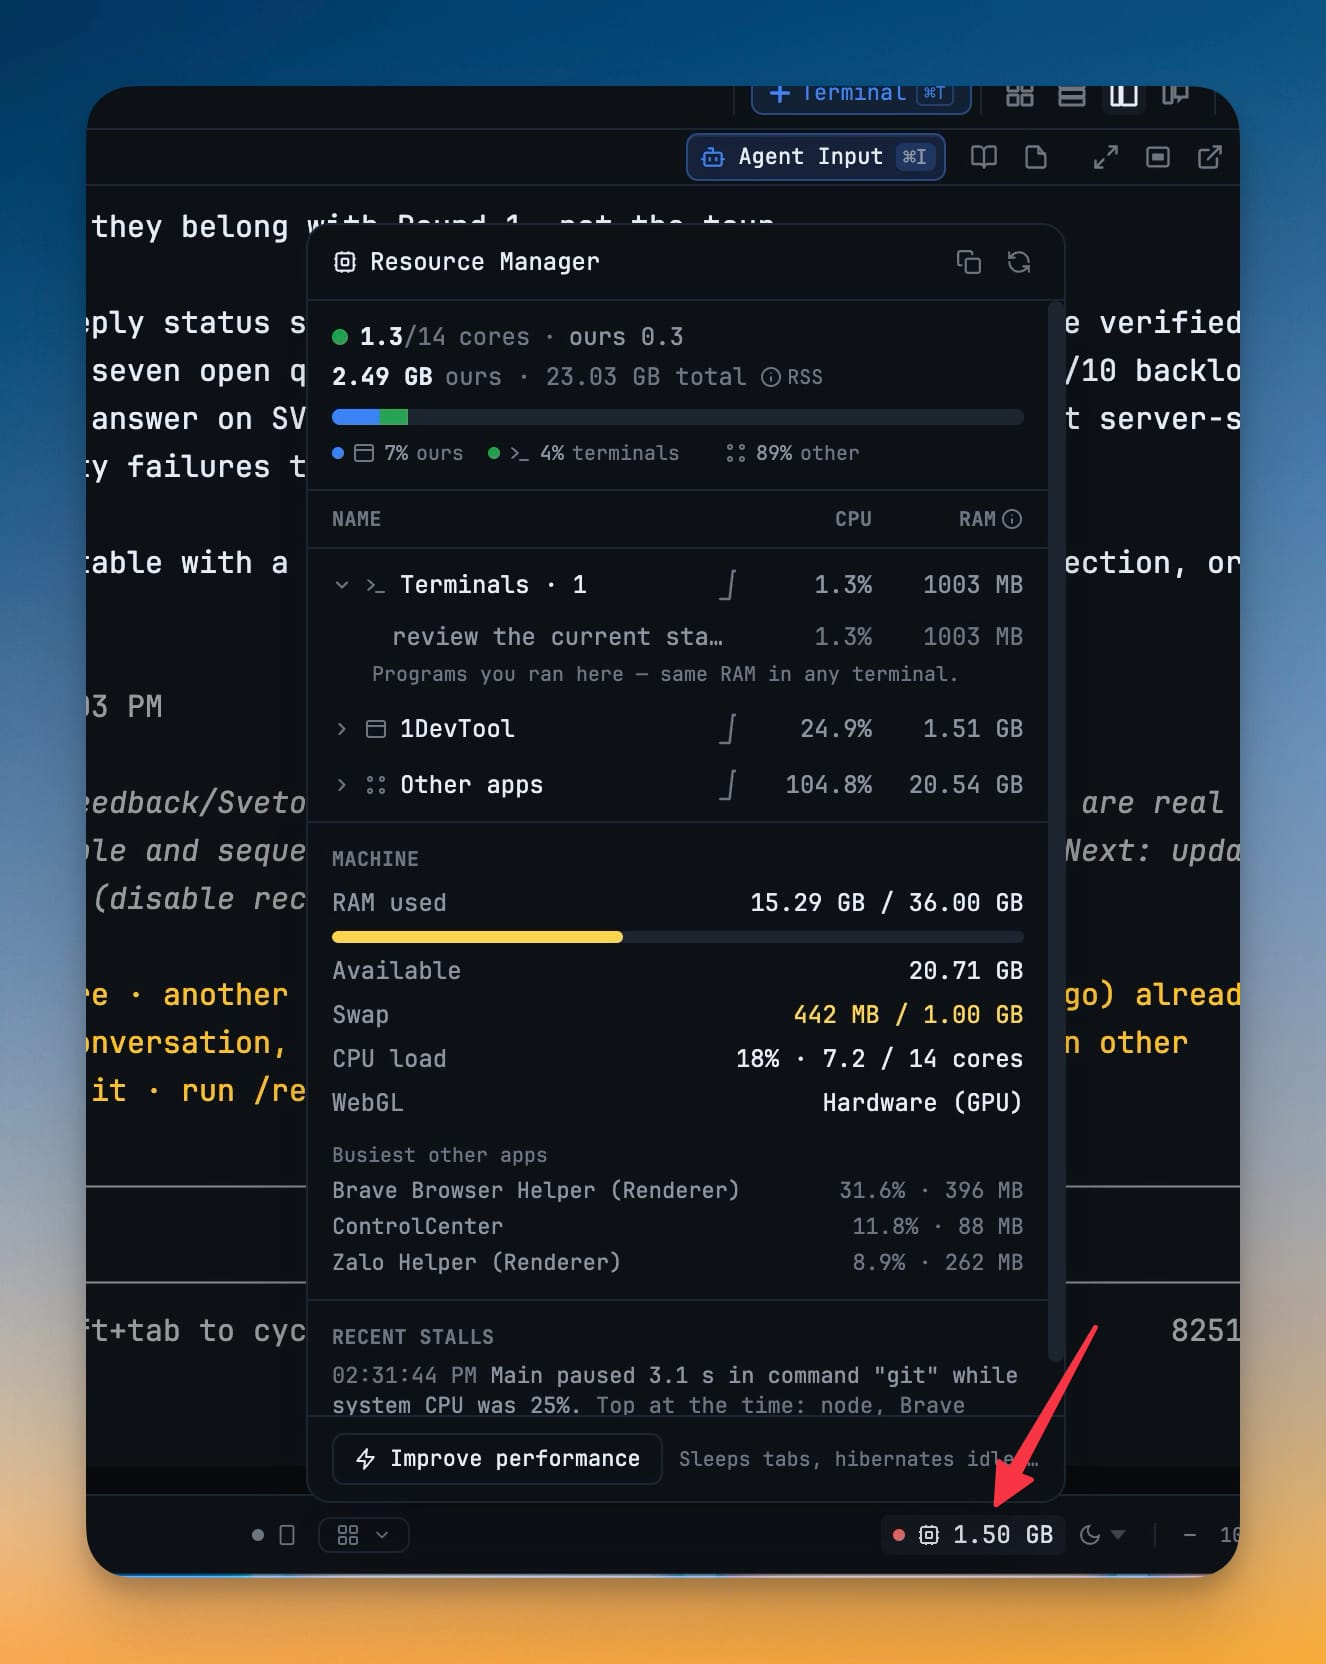
Know why the window froze instead of wondering whether the app died. A red dot appears in the status bar while 1DevTool is stalled, a toast afterwards names the duration, the system CPU and the processes that caused it, and every stall this session is listed under Settings → General → Diagnostics.
Why You Need This
How this feature boosts your daily productivity
A frozen window is the least informative failure a desktop app can hand you. You do not know whether it crashed, whether the machine is thrashing, or whether one of your own agents did it — so you wait, click a few more times, and eventually force-quit and lose the session. 1DevTool now watches its own main thread and tells you what happened. While the window is unresponsive a red dot sits in the status bar, so you know the app is stalled rather than dead and you stop clicking. When it recovers, a short toast reports the facts: *“1DevTool paused 6.2 s while system CPU was 98% — top: claude, node”*. Every stall is kept for the session and rendered in the same plain wording in the Resource Manager's **Recent stalls** list and under **Settings → General → Diagnostics** — *“Main paused 3.1 s in command `git` while system CPU was 25%”*, or *“Window paused 1.8 s (renderer did not respond)”*, naming the request, background poll or command that was in flight at the time. That settings page also holds the **Main-thread watchdog** toggle, the **Stall threshold**, an opt-in for **Send stall reports**, and the **Lower terminal priority under memory pressure** switch. A freeze becomes something you can report with numbers rather than a feeling. A stall report now blames a call only when it held a real share of the pause. Short reads that just happened to run during it are listed separately as bystanders, so the culprit is not buried among innocent calls. To send stalls to support, use Export diagnostics in the same section.
How It Works
Get started in 4 simple steps
Notice the red dot
While the window is unresponsive a red dot sits in the status bar, so you know 1DevTool is stalled rather than dead and you stop clicking.
Read the toast when it comes back
A short toast reports the facts: "1DevTool paused 6.2 s while system CPU was 98% — top: claude, node".
Check Recent stalls
Every stall this session is listed in the Resource Manager and under Settings → General → Diagnostics, naming the request, background poll or command that was in flight: "Main paused 3.1 s in command git while system CPU was 25%".
Tune the watchdog
The same settings page holds the Main-thread watchdog toggle, the Stall threshold, an opt-in for Send stall reports, and Lower terminal priority under memory pressure.
Without 1DevTool
The manual way vs. the 1DevTool way
The Hard Way
The 1DevTool Way
Key Capabilities
Everything included with Stall Diagnostics
Why It Matters
The productivity impact of having project management built into your workspace
Instant Project Switching
Switch between projects in one click with complete state restoration. No more 5-minute setup rituals.
Visual Organization
Color-coded projects, file type icons, and layout presets keep your workspace organized and recognizable.
Smart File Navigation
.gitignore-aware filtering, instant search, and context menus make finding and opening files effortless.
Workspace Memory
Every project remembers its terminals, open files, database connections, and layout. Pick up exactly where you left off.
More in Project Management
Other features in this category you might find useful
Multi-Project Workspace
Work on multiple projects simultaneously with instant switching. Entire workspace state is preserved per project.
Smart File Explorer
Real-time file tree with type icons, .gitignore filtering, search, and right-click context menus.
Per-Project Code Intelligence
Spawn real typescript-language-server, gopls, pyright, rust-analyzer, clangd, solargraph, intelephense, or sourcekit-lsp for the projects you opt into — with project-aware errors and zero false positives.
Color-Coded Projects
Assign accent colors to each project for instant visual identification across your workspace.
Ready to boost your workflow?
Download 1DevTool for free and experience Stall Diagnostics along with 345 other features — all in one app.