Resource Manager
Split CPU and memory into 1DevTool, your terminals and other apps — then reveal the pane that is actually the problem.
Six agents running at once is six CLIs, six PTYs, and however much scrollback each has accumulated — and your operating system files every one of those processes under 1DevTool, because 1DevTool is what started them. Resource Manager turns the single number in the status bar into a split you can act on.
Click the memory reading in the status bar to open it.
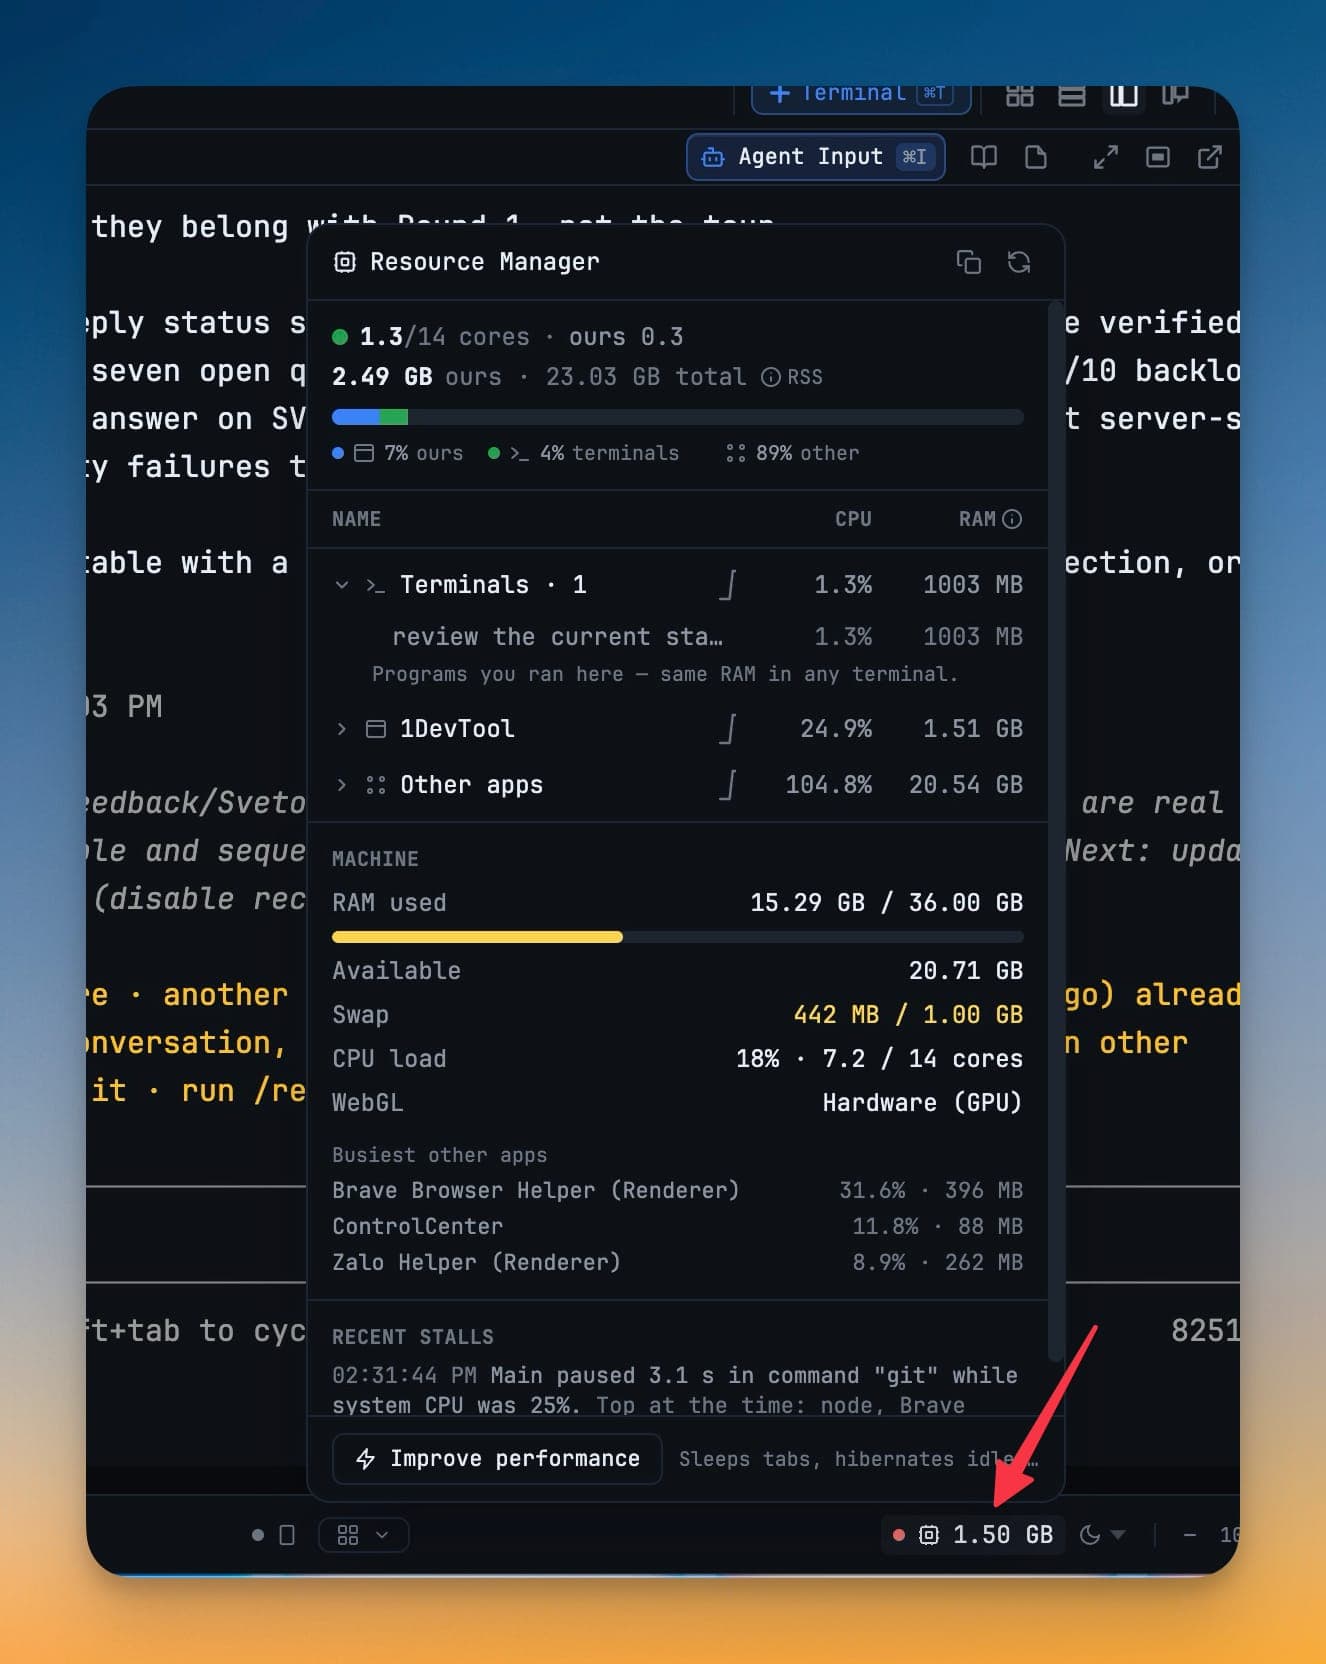
Three buckets that add up
The header carries the summary: cores in use against the cores you have, resident memory that is ours against the machine total, and a bar splitting that memory three ways. Below it, the tree:
- 1DevTool — the app's own processes: window, renderers, GPU helper and terminal host. On macOS these are the "Helper (Renderer)" rows in Activity Monitor.
- Terminals — every terminal you started, named the way its tab is. The row explains itself: "Programs you ran here — same RAM in any terminal. Task Manager nests them under 1DevTool." Those processes cost the same in any terminal app; your OS was simply attributing them to us.
- Other apps — everything else on the machine.
The three add up to what your OS reports, which is the point: instead of one number you cannot act on, you can see how much of it was never ours.
Expand a bucket to get the individual terminals and processes behind the number, each with its own CPU and RSS. Each group draws a live CPU sparkline while the panel is open, holding about a minute of history and self-scaling to its own recent peak, so an idle terminal still reads as idle rather than being flattened by a busy neighbour.
On platforms that cannot report per-process figures, the panel says so directly — Per-terminal CPU/RAM isn't available on this platform — instead of showing zeros.
The attention strip
When a pane pins the CPU across two consecutive samples, or starts flooding output, it gets its own row above the tree: the terminal's name, the reason in plain terms — 62% CPU, or 8.4 MB/s output · throttled — and a Reveal button that brings that exact pane forward in whatever slot and layout it lives in.
Behind the row's ⋯:
- Pause output — stop a firehose without killing the run. Press it again to resume.
- Lower priority — drop that terminal's whole process tree to below-normal CPU priority. On macOS and Linux this is one-way, so the button reads Lowered (until exit) afterwards; on Windows it can be restored.
- Hibernate — shut the agent's CLI down and keep the tab. See Hibernation.
- Close — close the terminal.
Machine
Underneath the tree:
- RAM used / total, with a bar
- Available — free plus reclaimable cache the kernel can hand out without swapping
- Swap used / total, highlighted when the kernel has actually paged to disk
- CPU load against your real core count
- WebGL — whether rendering is on hardware or has fallen back
- Busiest other apps — the processes outside 1DevTool competing for the same machine, so an expensive browser gets named rather than blamed on the workspace
Recent stalls
If the window has stopped responding at any point this session, the pauses are listed here in plain words — "Main paused 3.1 s in command git while system CPU was 25%." The same list, with its settings, lives under Settings → General → Diagnostics; see Freezes & Slowdowns.
Copy diagnostic report
The copy control in the header puts a Markdown summary on your clipboard: the three buckets, the top consumers, GPU rendering status and any recent stalls. It is meant to be pasted into a bug report, so the conversation starts from numbers rather than "it felt slow yesterday."
Use ↻ Refresh now beside it to take a fresh sample at any time.
Improve performance
One button in the footer sleeps inactive browser tabs, hibernates idle agents and clears terminal buffers in a single step. Nothing is closed: tabs wake on click, agents resume on a keypress, and only buffered scrollback is released — your sessions keep running and nothing about the agents' state changes. See Session Persistence for what survives a restart.
When the machine is low on memory the footer says so — Low on RAM, or Paging to disk · 442 MB swapped — and the button is highlighted.
Related
- Hibernation — how idle agents and browser tabs give their memory back on their own
- Freezes & Slowdowns — what the stall indicator and the diagnostics settings do
- Terminal Tips — getting more out of a busy terminal grid
- AI Usage — what your agents are spending, as opposed to what they are using
- Layout Modes — fitting several terminals on one screen