Charts
Draw how your terminals work together — an org chart or a pipeline — in one library under Set up, then start the team from the canvas.
Charts is where you draw the relationships between your terminals: who reports to whom, and who hands work to whom. It lives at Orchestration → Set up → Charts, and every org chart and pipeline you have saved is in that one list.
Charts was called The Builder before 1.67.0. Same canvas, one library, and a name that says what it draws.
It does only that one job. The table that decides who takes unnamed work — and what happens when a run fails — is Defaults, under Advanced.
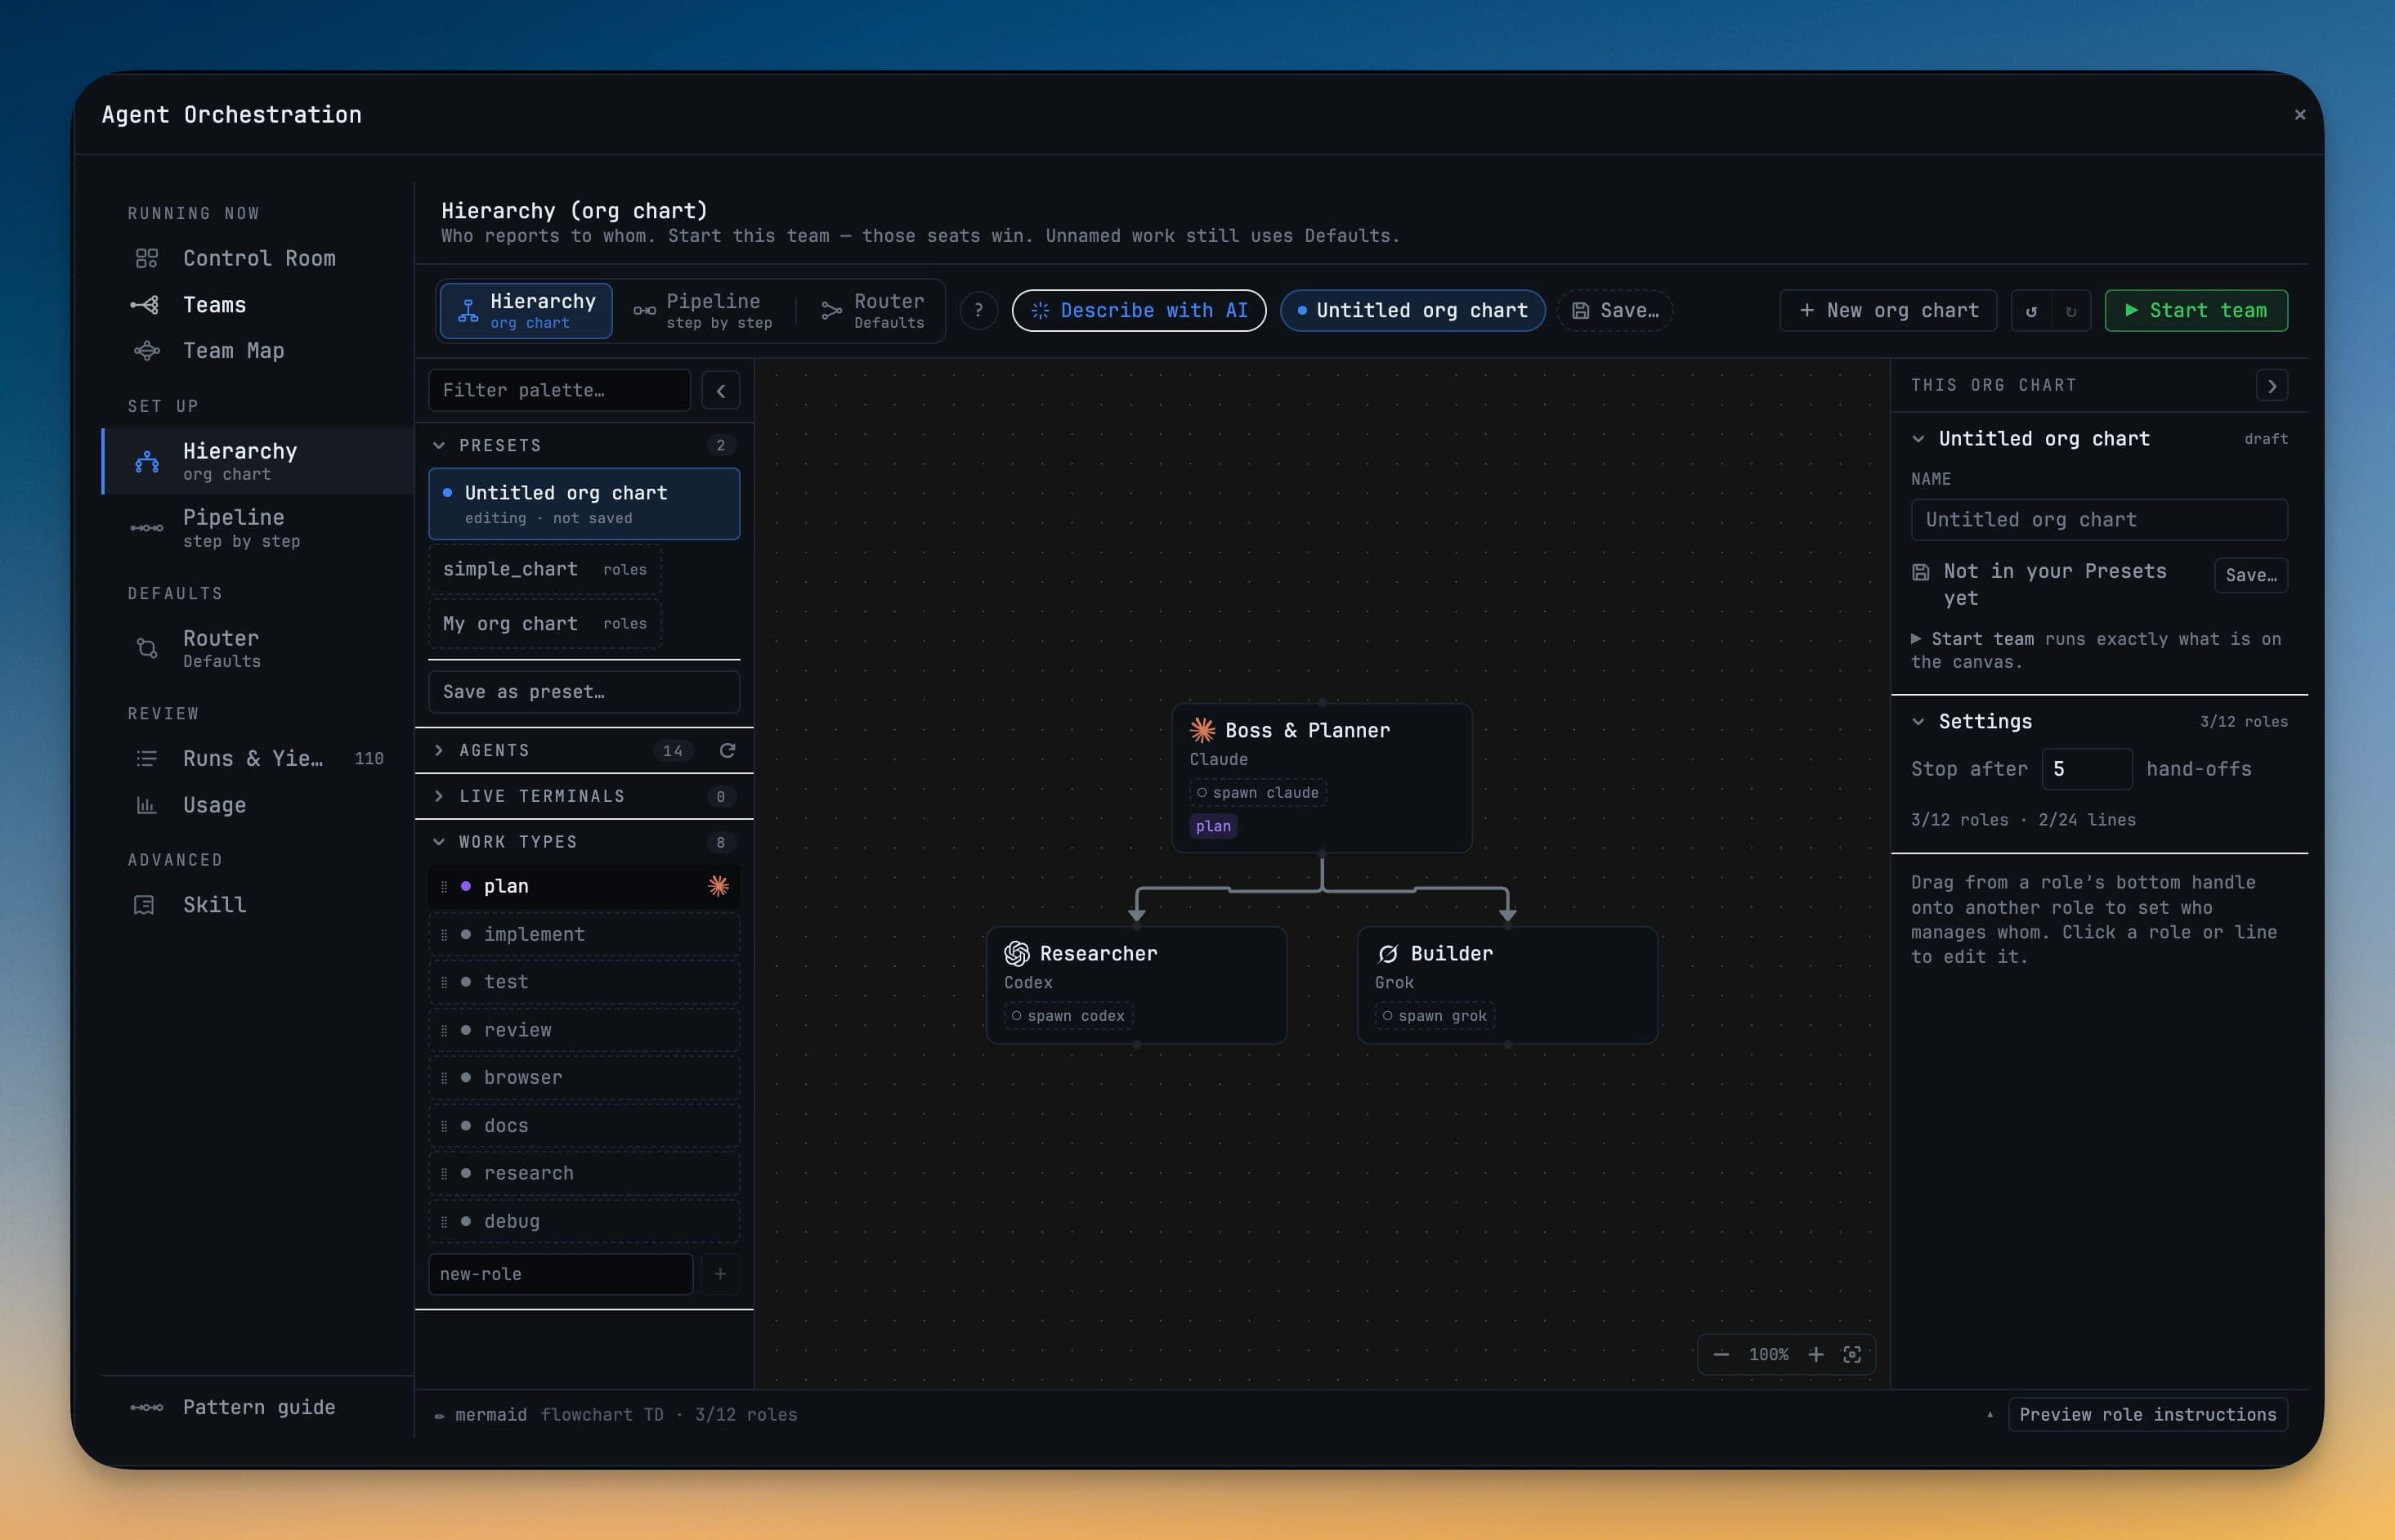
The two shapes
| Shape | What it says | Use it when |
|---|---|---|
| Hierarchy (org chart) | Who manages whom. A seat may task only its own subordinates, and reports results upward. | One agent should own the plan and delegate the parts. |
| Pipeline (step by step) | Who hands to whom, in order, with a quality gate on each hand-off. | The work is stages — research, then implement, then review. |
Each shape keeps its own draft. Looking at Pipeline never converts the org chart you were building, and converting one into the other is an explicit Convert my pipeline / Convert my org chart card that you choose — not a gate you pass through by pressing a mode switch.
Start a chart
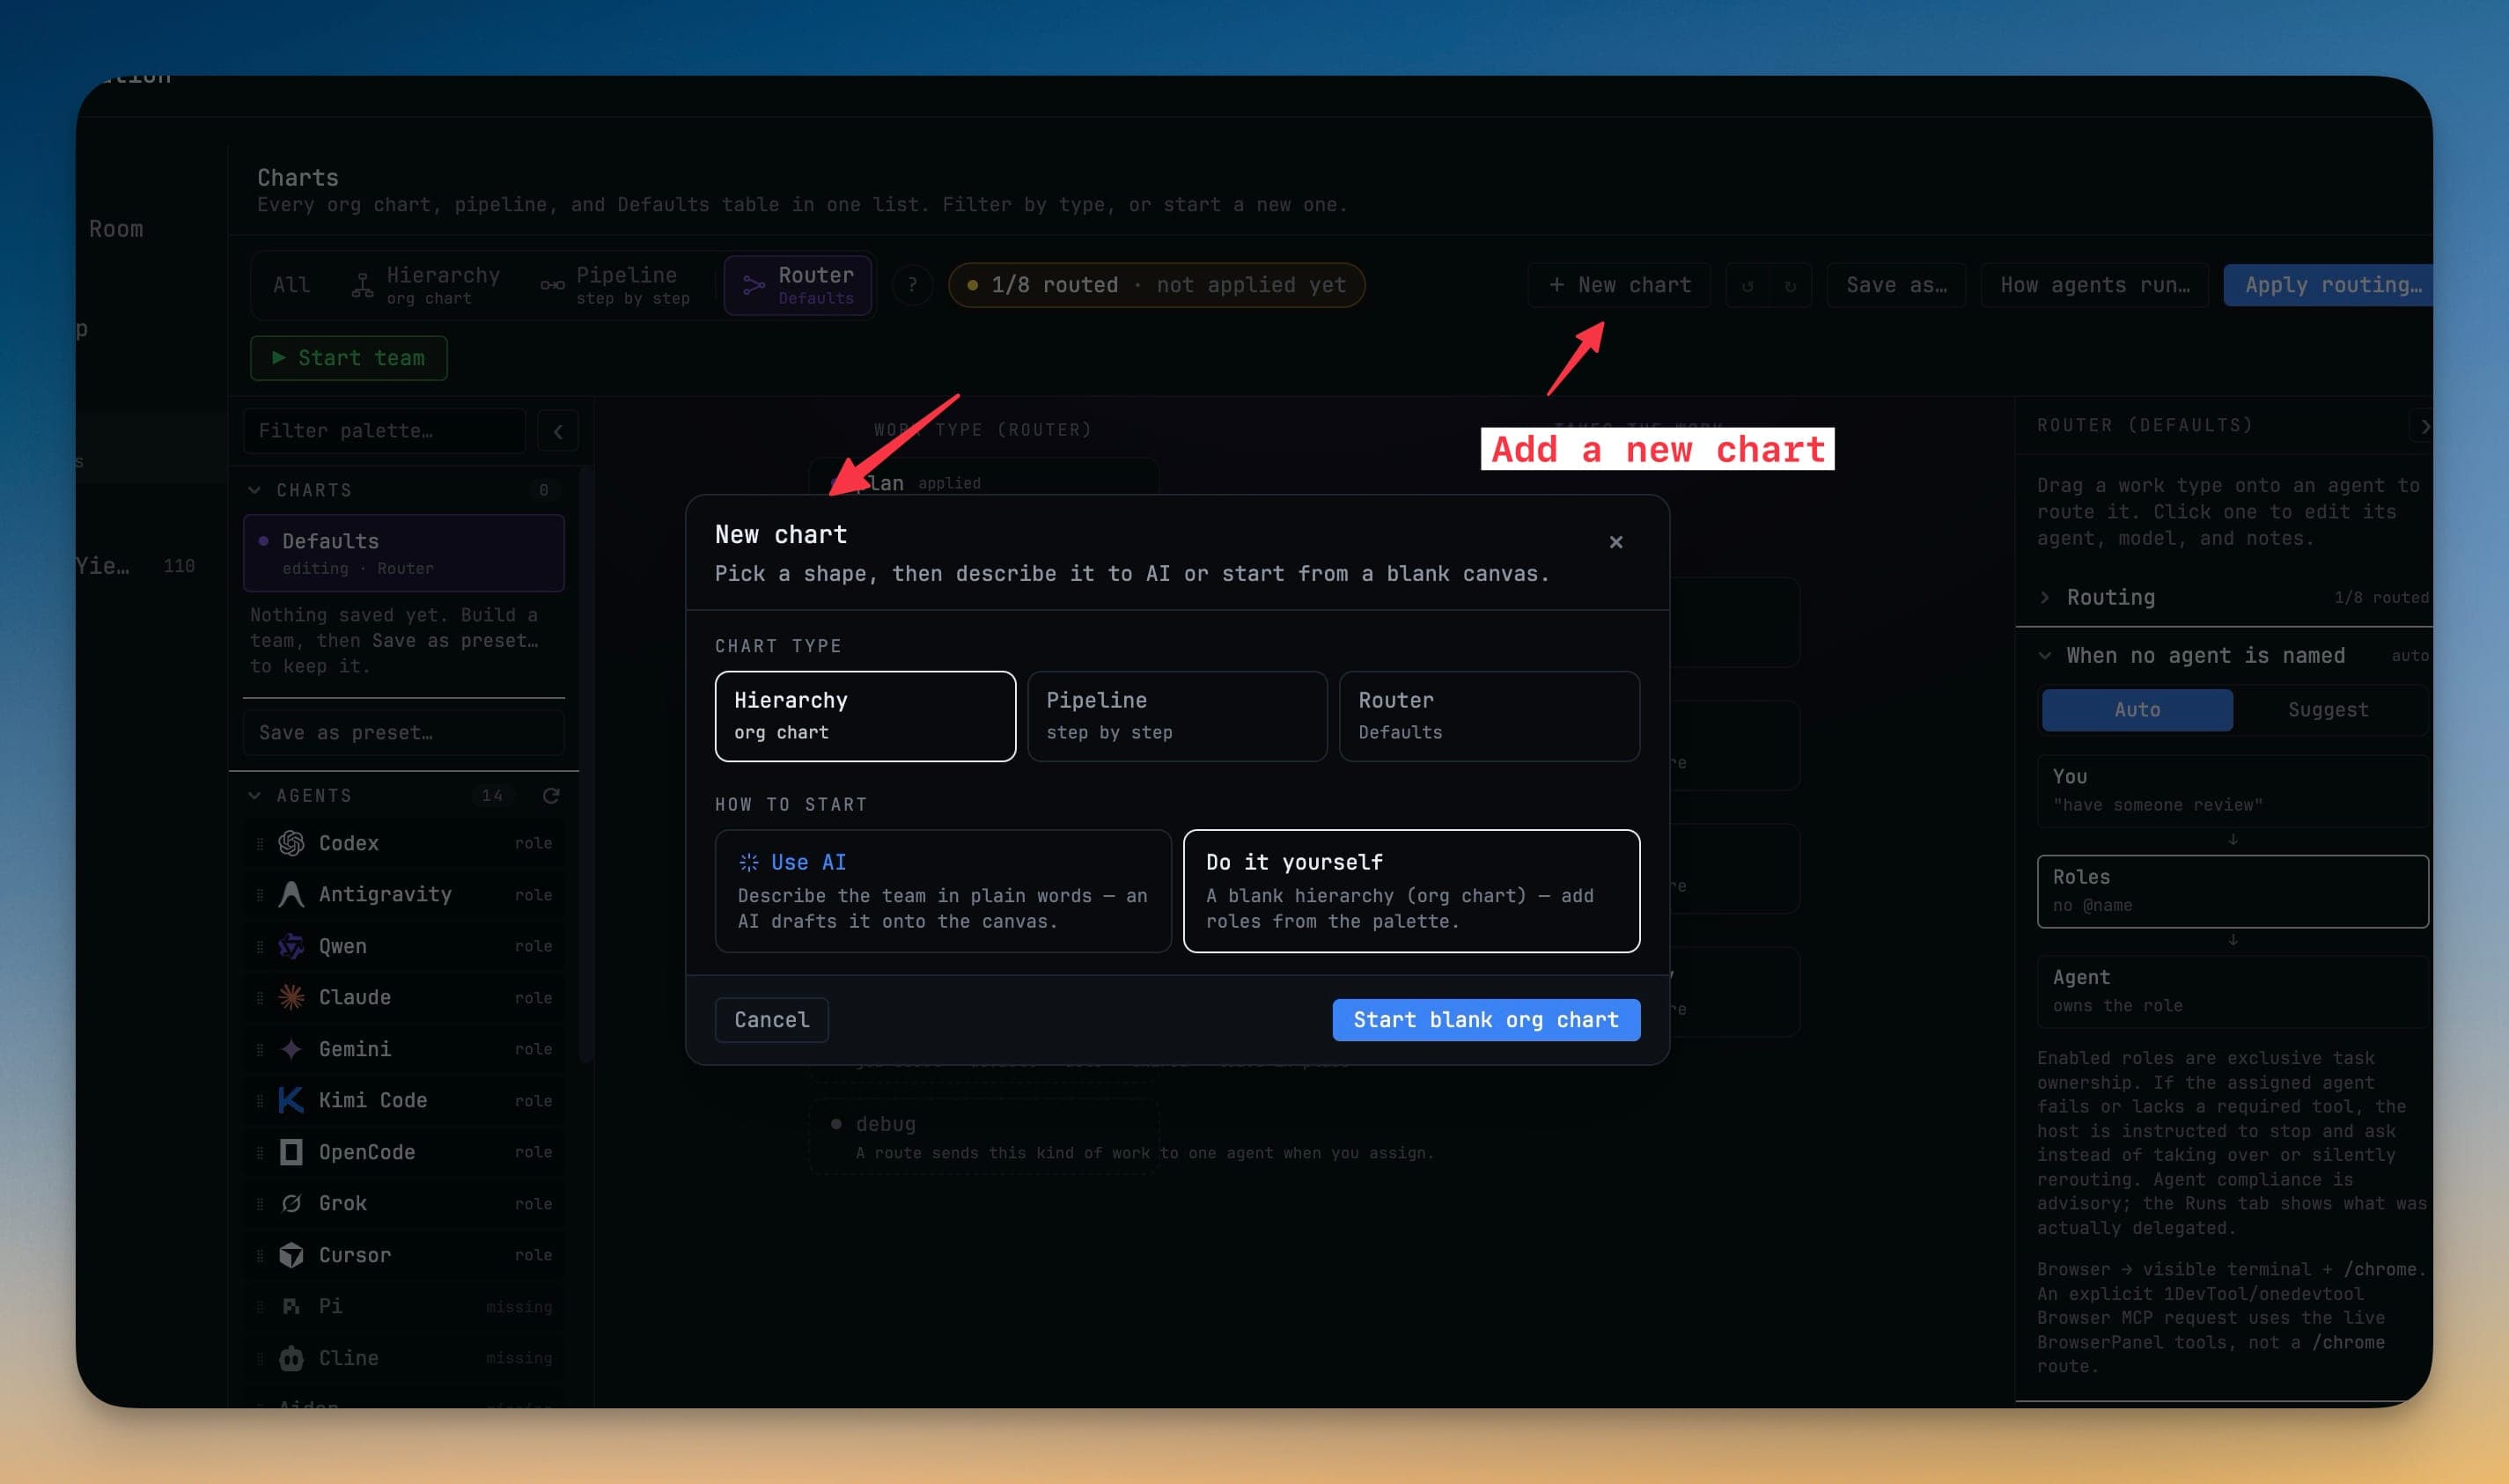
Press + New chart. The dialog asks two things — the shape, and how you want to start:
- Use AI — describe the team in plain words and an AI drafts it onto the canvas.
- Do it yourself — a blank canvas; add roles from the palette.
Chain the terminals you already have open
With two or more AI terminals running in the project, you don't have to assign anything by hand:
- Agent Input offers "Draw how these N terminals work together".
- Charts' Chain my open terminals card drops exactly those terminals into a pipeline, seats already filled.
If the card is greyed out, the hint says why: Open at least two AI terminals in this project first.
Describe it and let an AI draw it
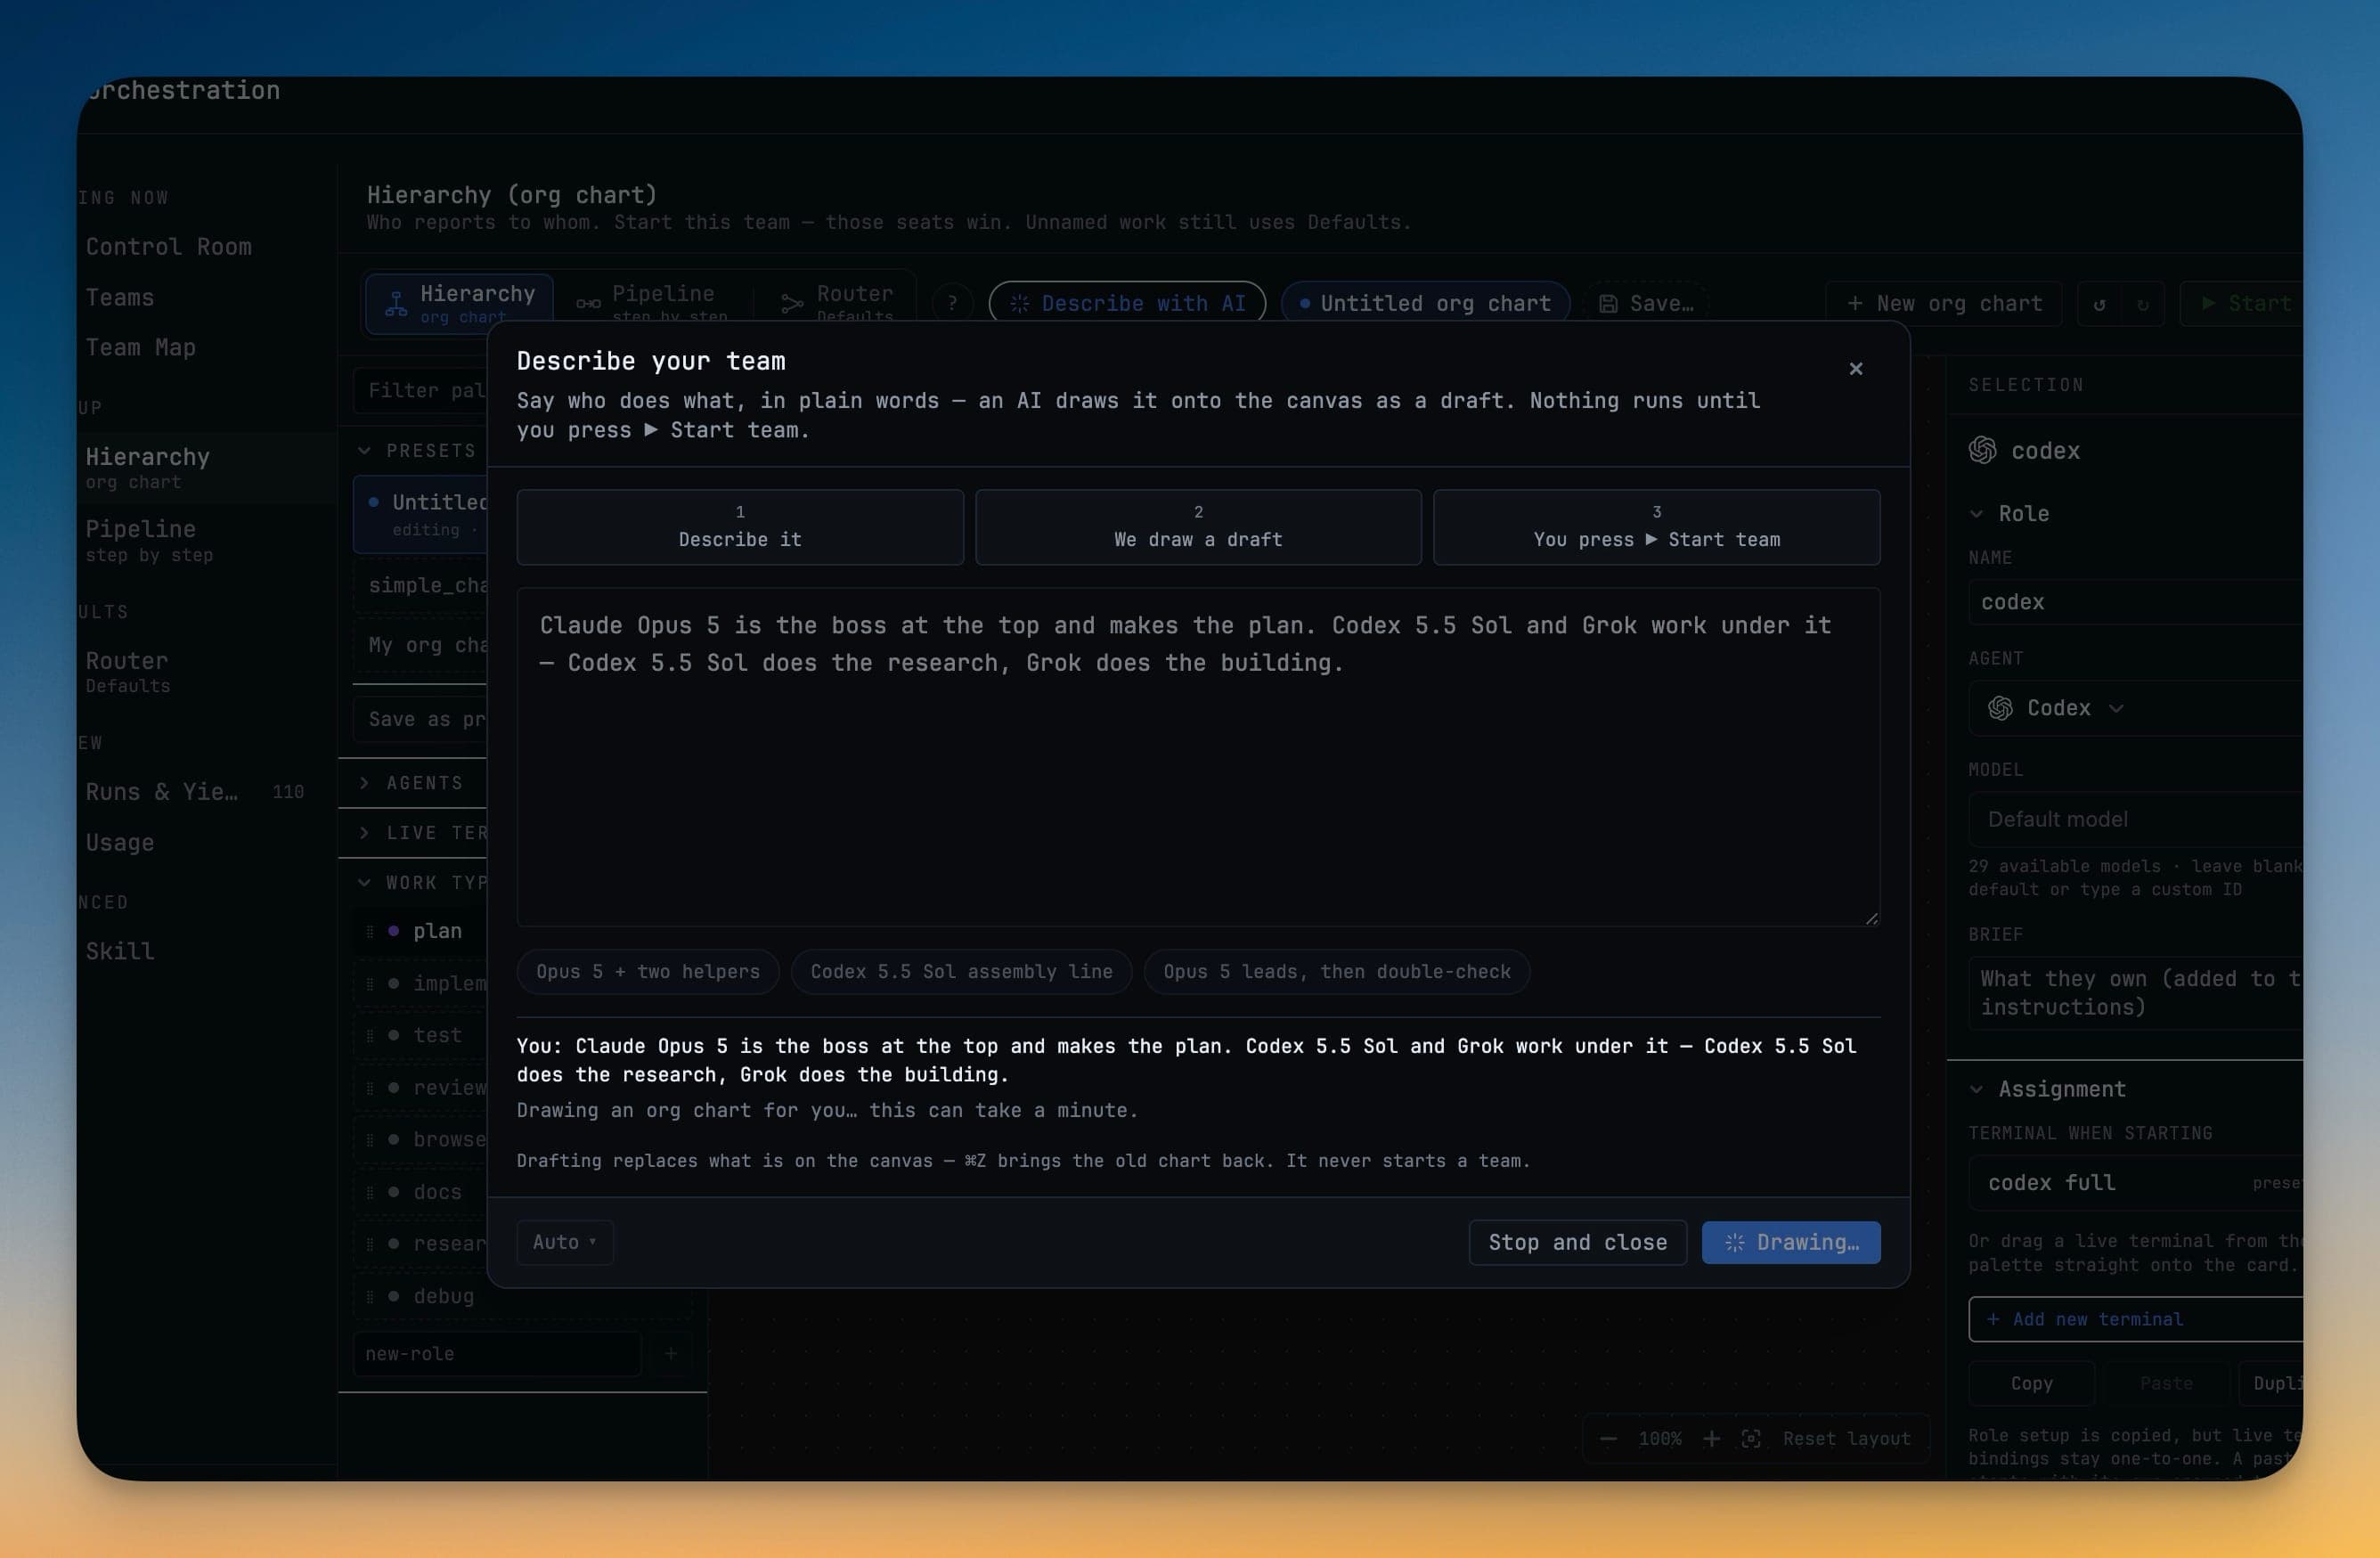
Click ✨ Describe with AI and write the team as a sentence — "Claude Opus 5 is the boss at the top and makes the plan. Codex 5.5 Sol and Grok work under it — Codex does the research, Grok does the building."
A three-step strip across the top states exactly what will happen: Describe it → We draw a draft → You press ▶ Start team. A Generate with chip picks which of your installed AI CLIs does the drafting, and shares that preference with the Draw canvas.
Drafting replaces what is on the canvas and nothing else. ⌘Z brings the old chart straight back, saved presets are never touched, and drafting never starts a team.
Edit the chart
- Drag a role's bottom handle onto another role to set who manages whom.
- Click a role or a line to edit it in the inspector — Role, Assignment, Relationships.
- The inspector's Assignment section binds a seat to a live terminal, or offers + Add new terminal.
- Starting a drag raises the seats that can accept it and dims the ones that cannot, so a refusal never costs you a dialog.
⌘Zundoes anything on the canvas, including an AI draft.
The header names the chart and answers two questions at a glance: is it saved, and is it what ▶ Start team would run? A chart you have not saved reads Not in your Presets yet, with Save… beside it.
Opening a saved chart
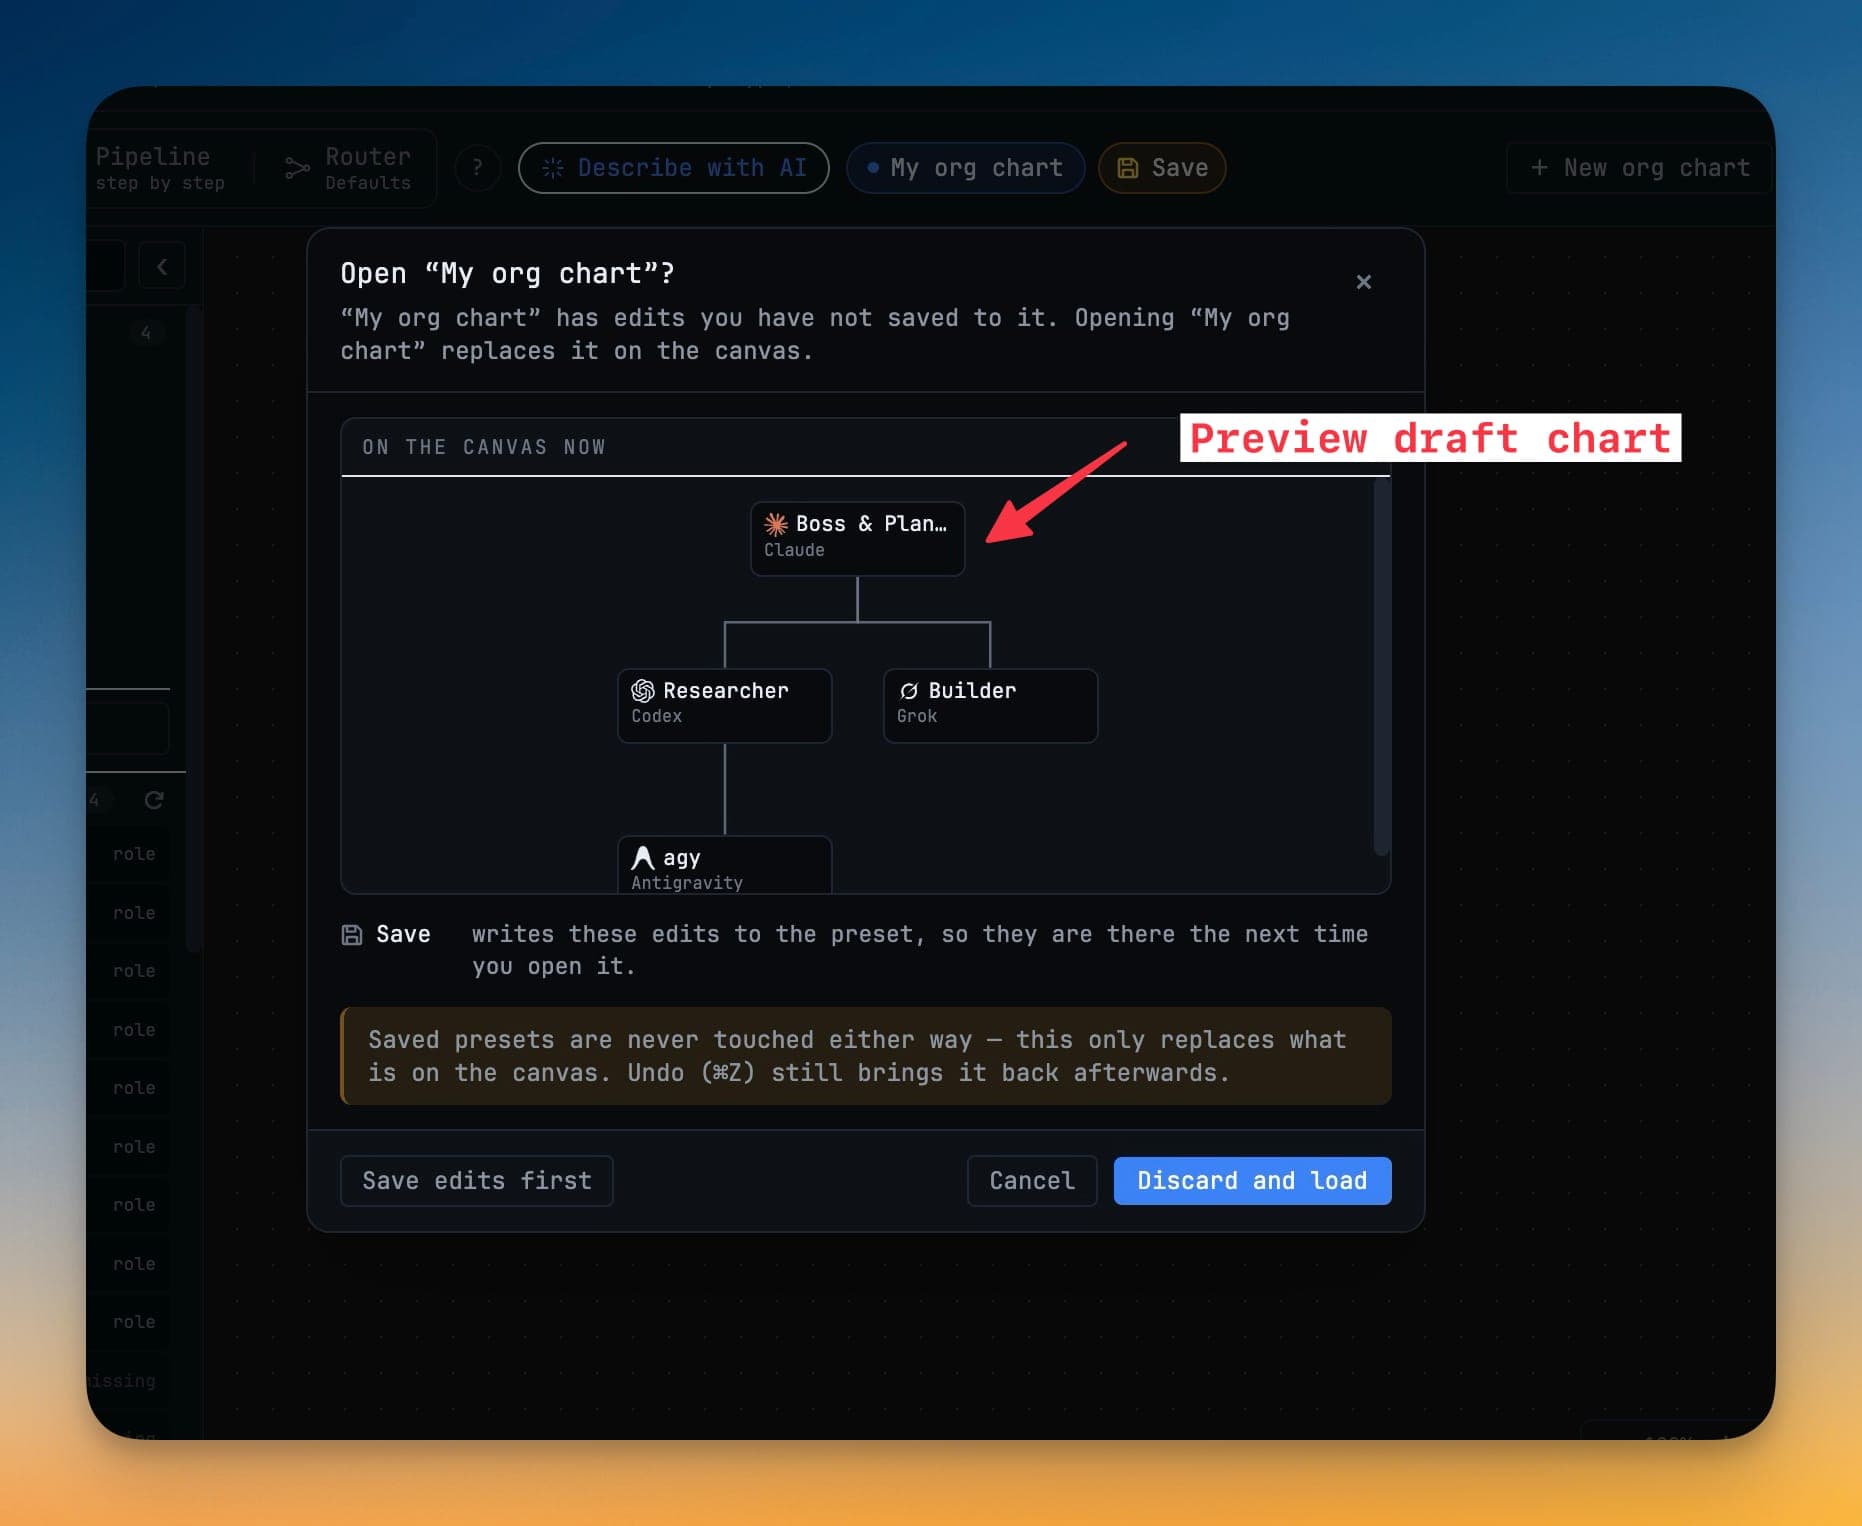
Opening a saved chart while you have unsaved edits previews the canvas first, then gives you three plainly-labelled ways out:
- Save edits first — write your edits to the preset, then load.
- Cancel — change nothing.
- Discard and load — replace the canvas with the saved chart.
Saved presets are never touched either way, and ⌘Z still brings the canvas back afterwards.
Start the team
▶ Start team runs exactly what is on the canvas. While the seat table is open, the confirm at its foot is the only Start button — you are never choosing between two controls for the same act.
Seats started this way win over Defaults: a named agent always beats the table. Once it is running, watch it in Mission Control and Team Map.
Watch setup, and fix a seat that missed out
Starting or restoring a team — from ▶ Start team, or from the Orchestration tab of Add Terminal — runs as a floating Setting up orchestration card rather than a dialog that blocks the window. It counts delivery down (Delivered to 1 of 4 terminals. You can keep working.) and collapses to a small Setting up · 1/4 pill when you want the space back.
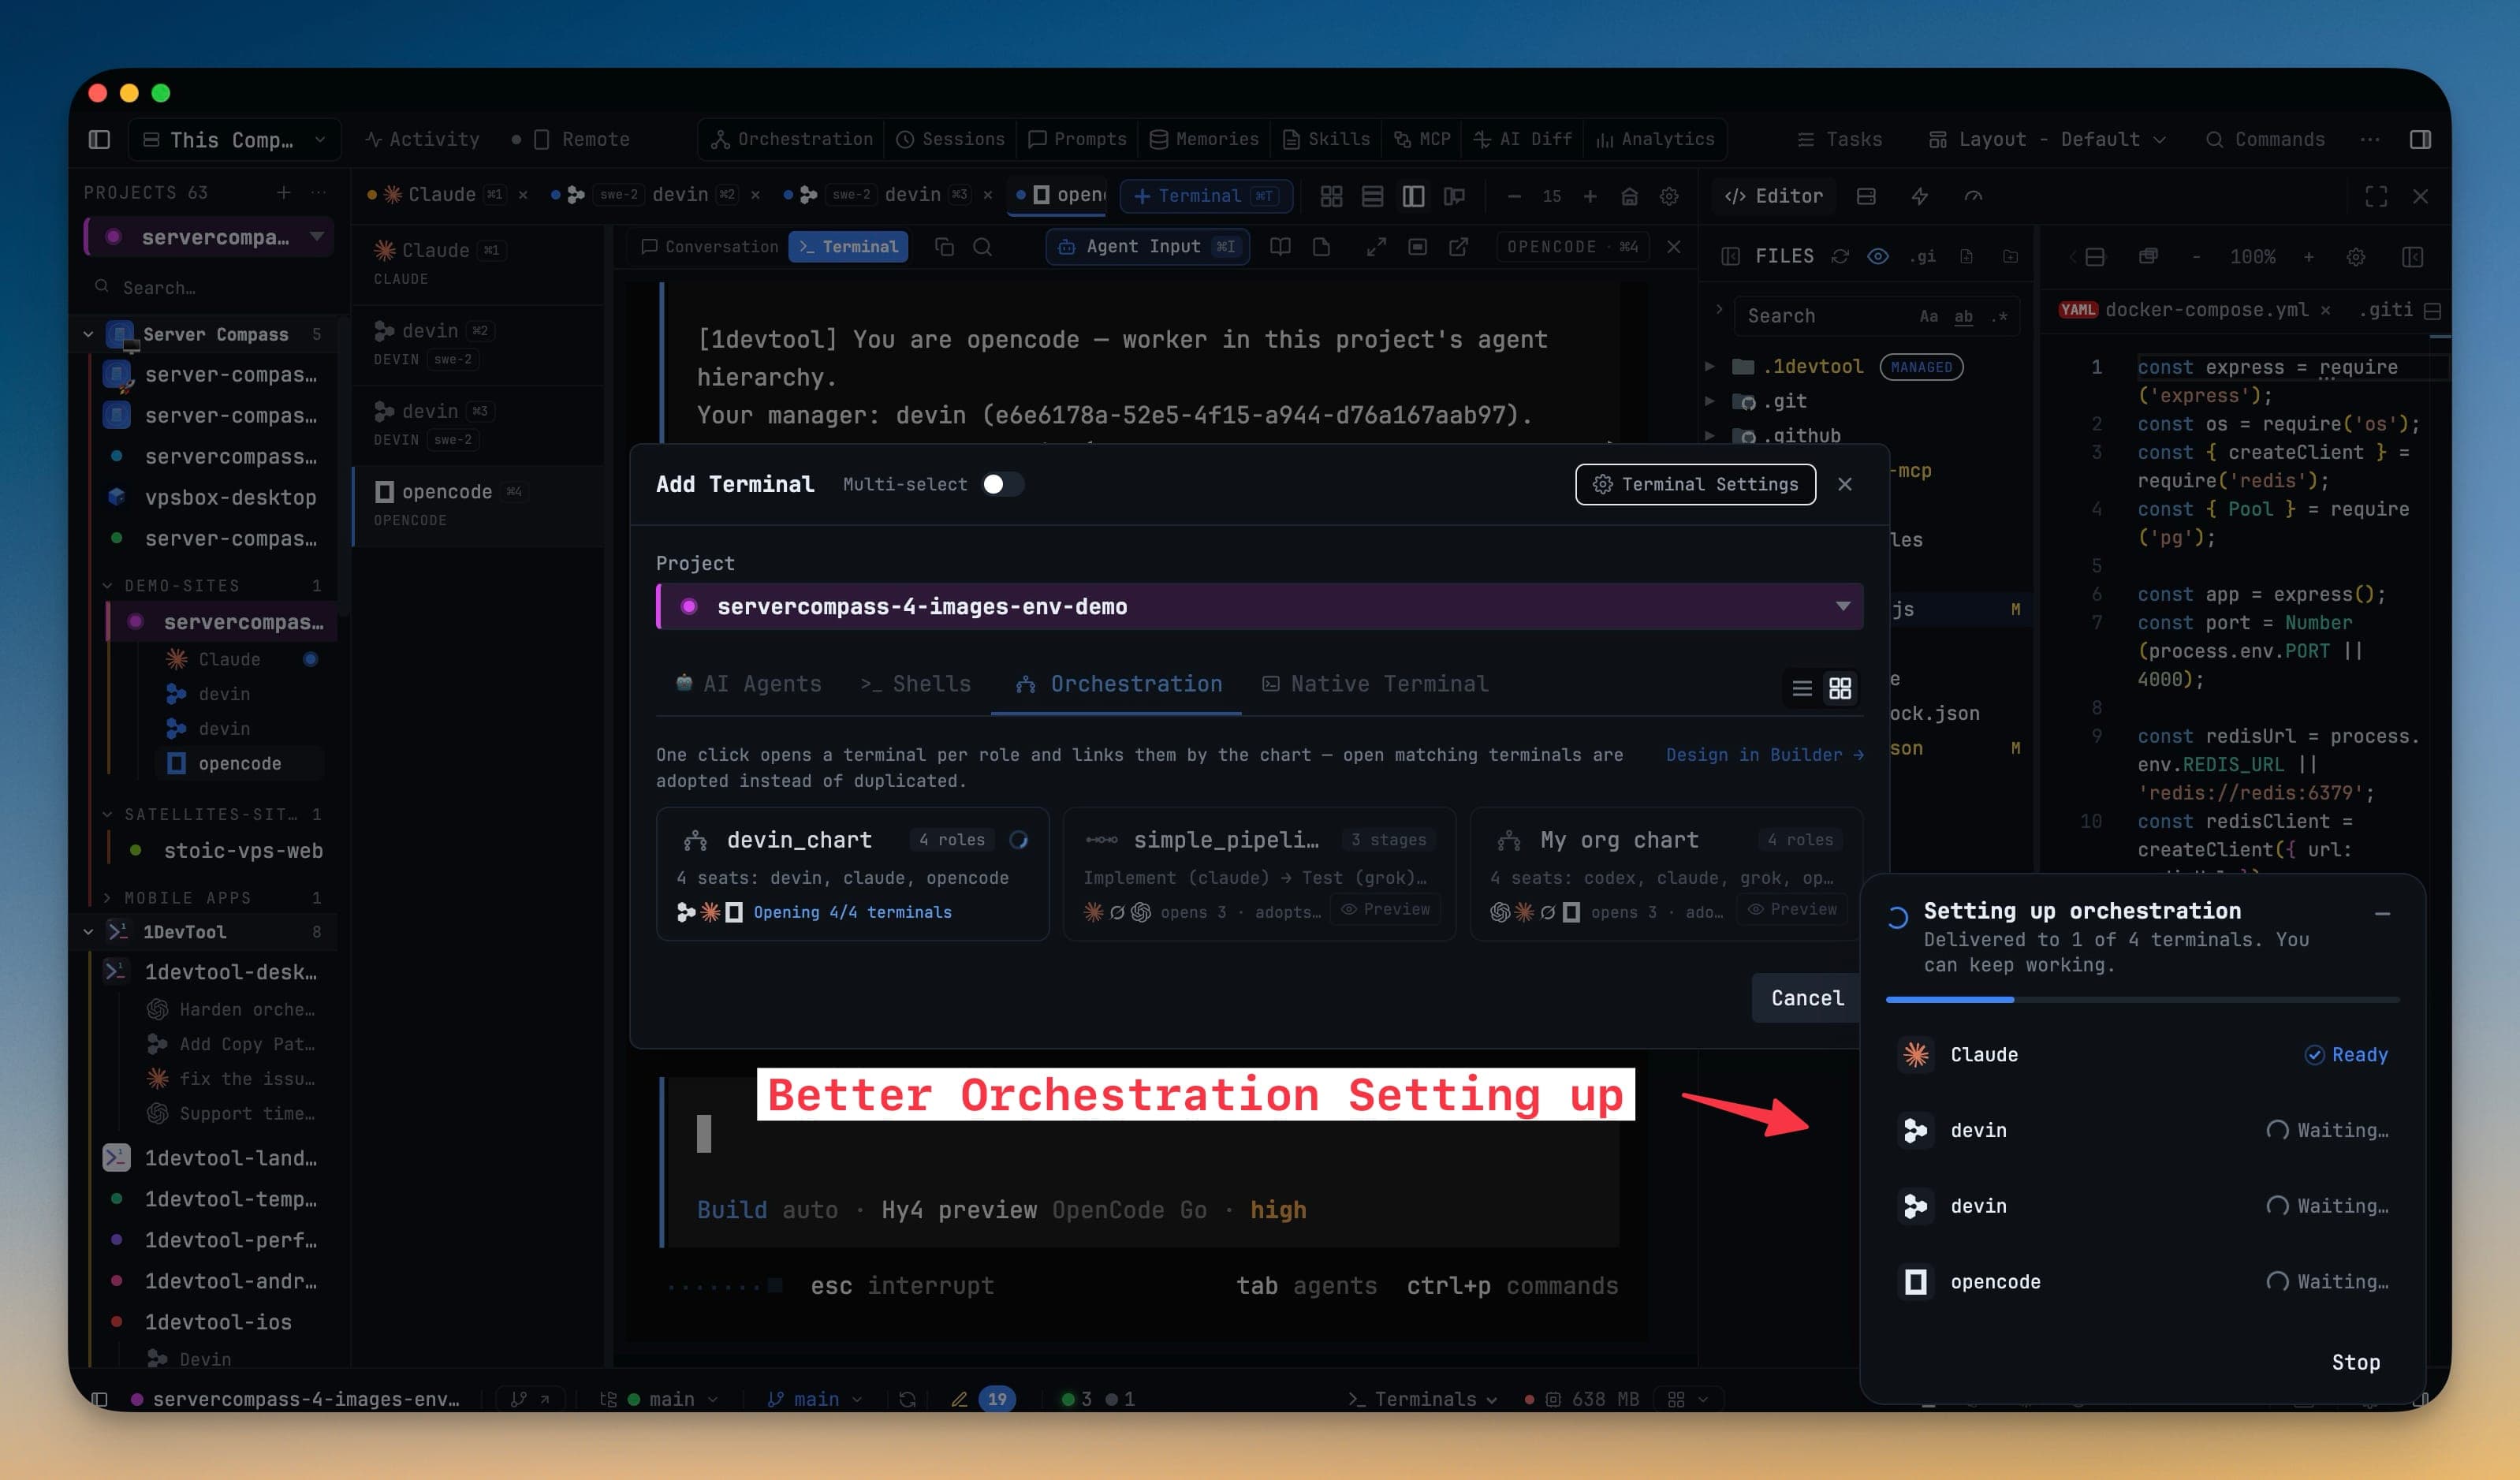
Every seat shows its state under its agent's logo:
- Waiting… — the terminal is opening or its role card is on the way.
- Sent — the role card was delivered; the agent has not confirmed it on screen yet. No action is needed, and a seat like this is no longer treated as a failure.
- Ready — the agent has its role.
- Needs you — delivery could not be confirmed, so this seat is a manual step.
A Needs you seat opens View instructions with the exact prompt it should have received, and four actions: Copy, Open terminal, Send to Terminal and I submitted it once you have handled it yourself. Check the terminal before pasting again — a delivery that could not be confirmed may still have arrived.
Stop cancels safely: writes already in flight settle before control comes back, so a stopped setup cannot leave a half-pasted role card in a composer. The terminals it opened are kept. When setup finishes, the card reads Orchestration ready or Orchestration needs a hand, with Dismiss and Later. Finish any manual steps before restoring or starting another team.
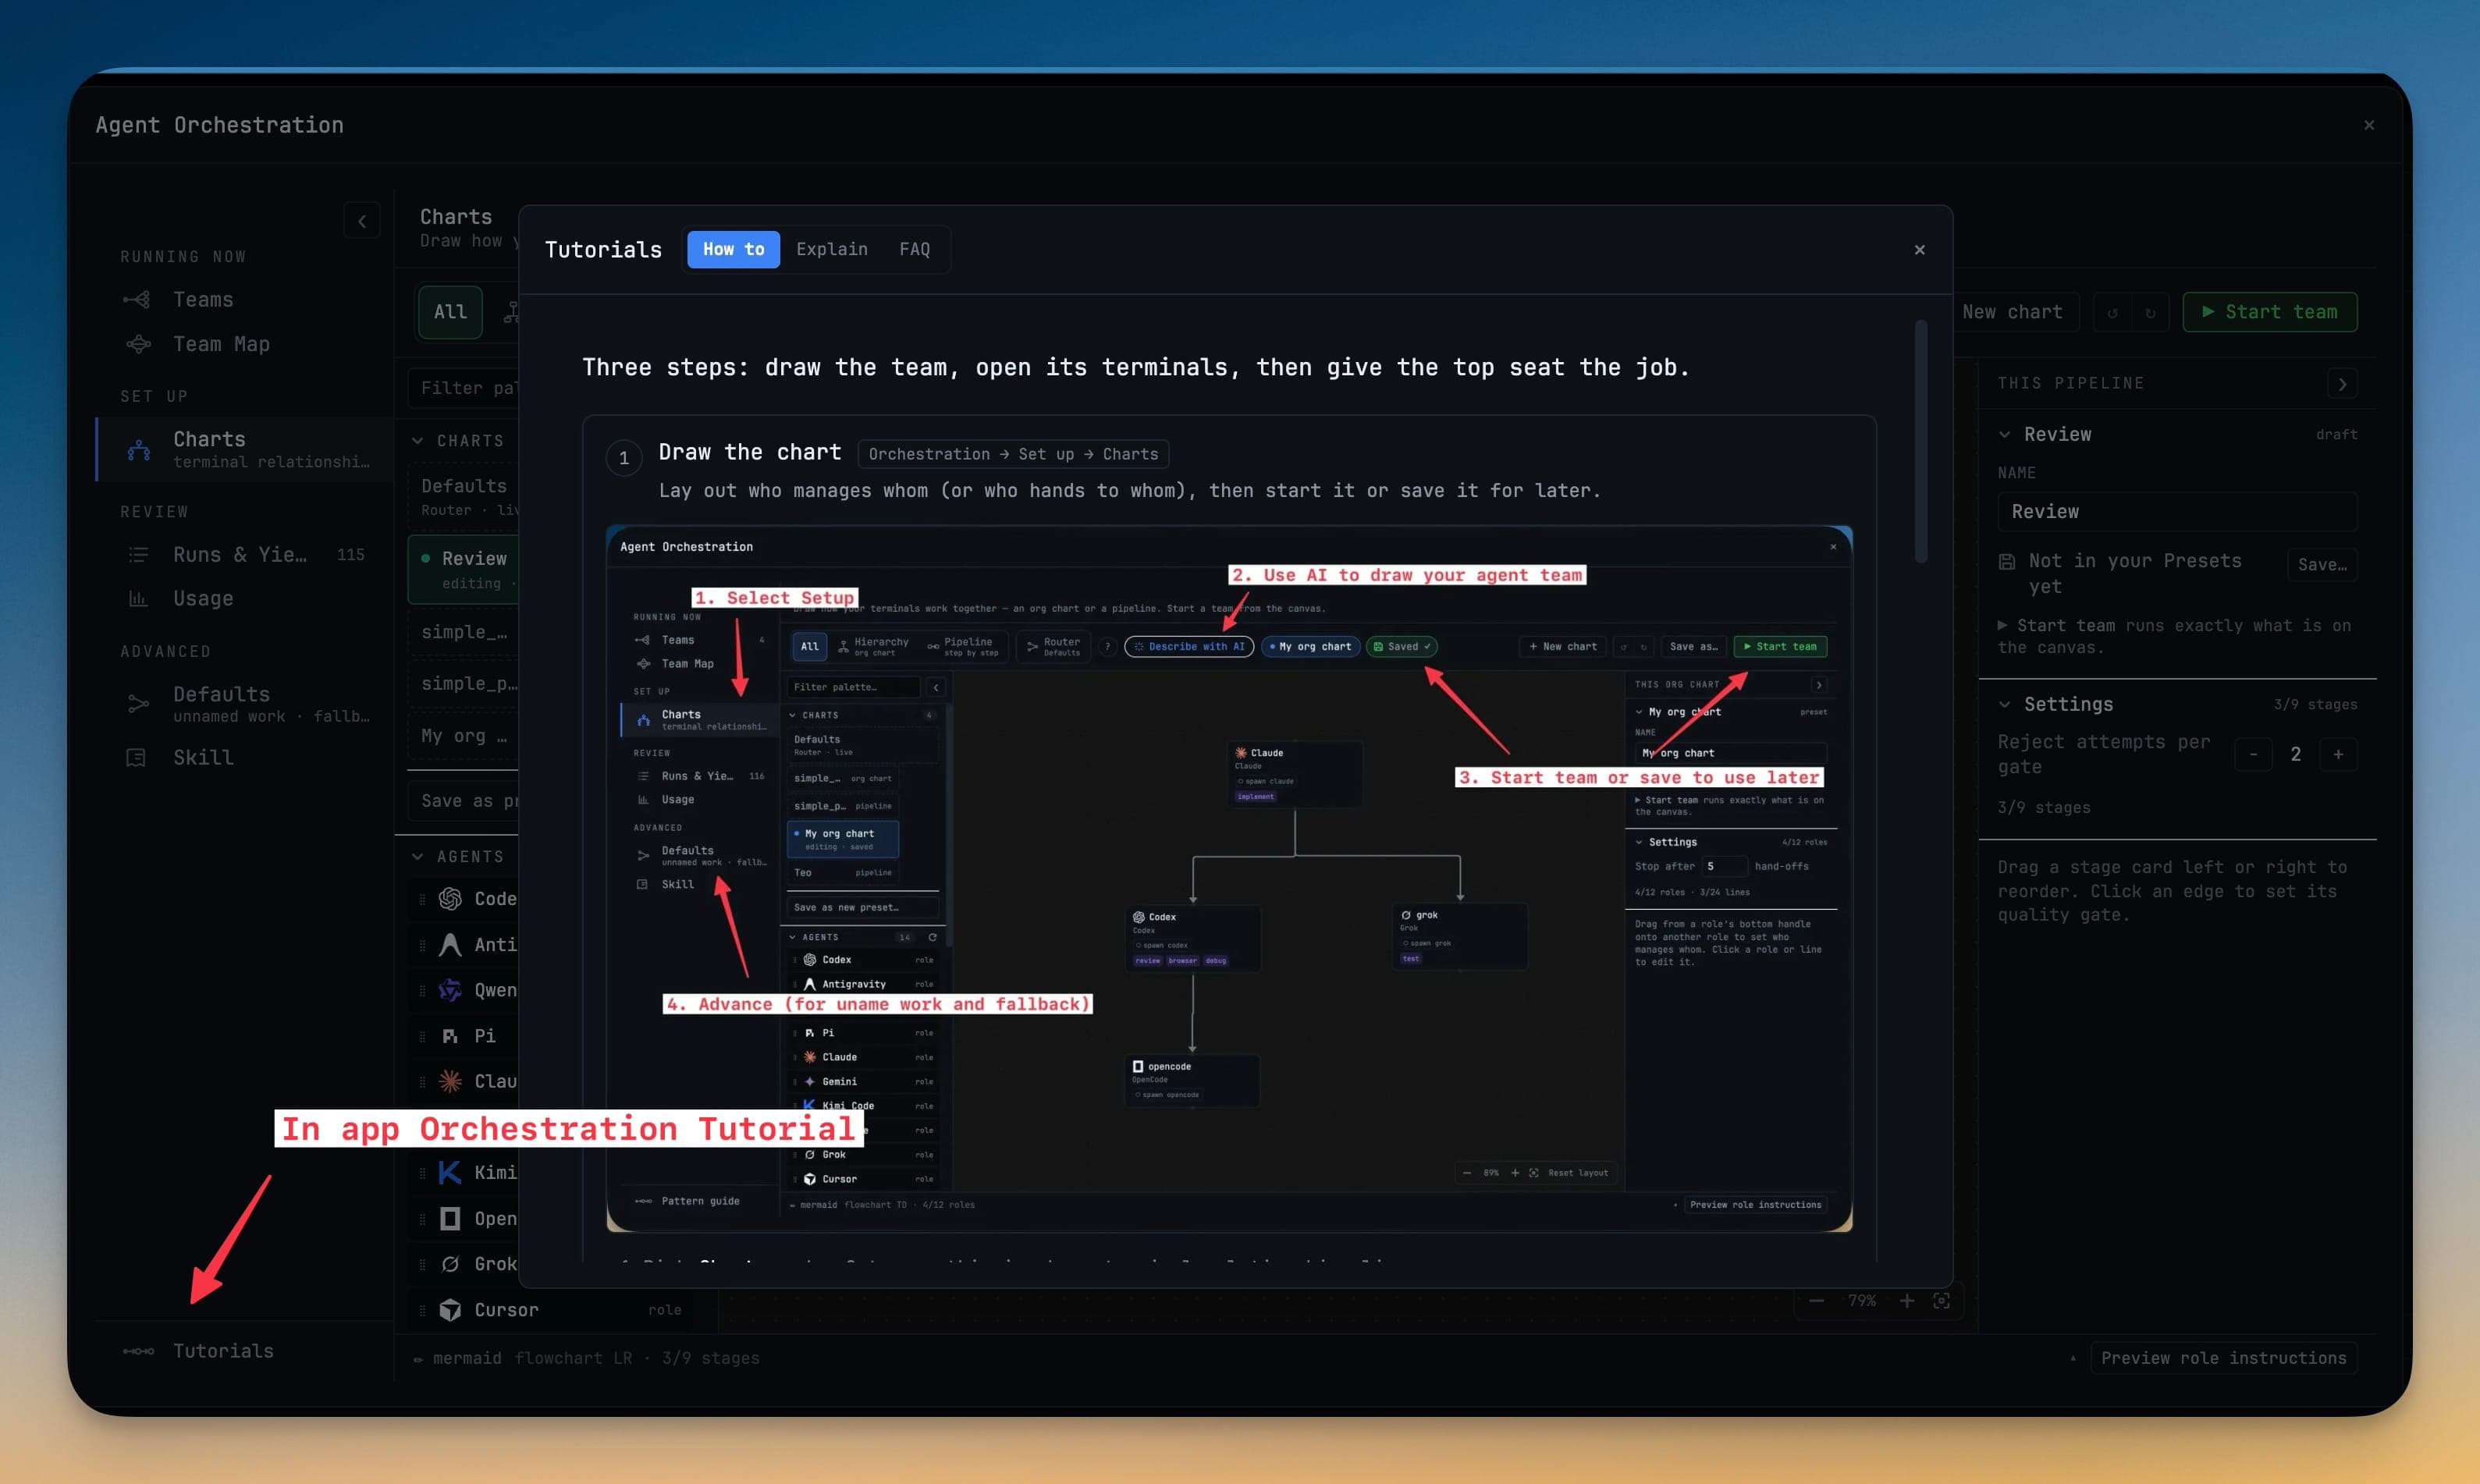
The in-app Tutorials panel at the foot of the rail walks the whole thing in three steps: draw the chart, open its terminals, then give the top seat the job.
Related
- Defaults & Fallback Chains — unnamed work, and what happens when a run fails
- Agent Hierarchy — how an org chart is enforced at runtime
- Pipeline — ordered stages and quality gates
- Agent Teams — what a started team actually is
- Mission Control — the cockpit above your terminals