Orchestration Dashboard
Teams, the map, routing, runs and logs, per-team token usage, and the compiled skill your agents are given.
The Orchestration Dashboard is the record of everything your agents have done together. Where Mission Control is the live cockpit, this is the log book.
Open it from Orchestration in the top bar.
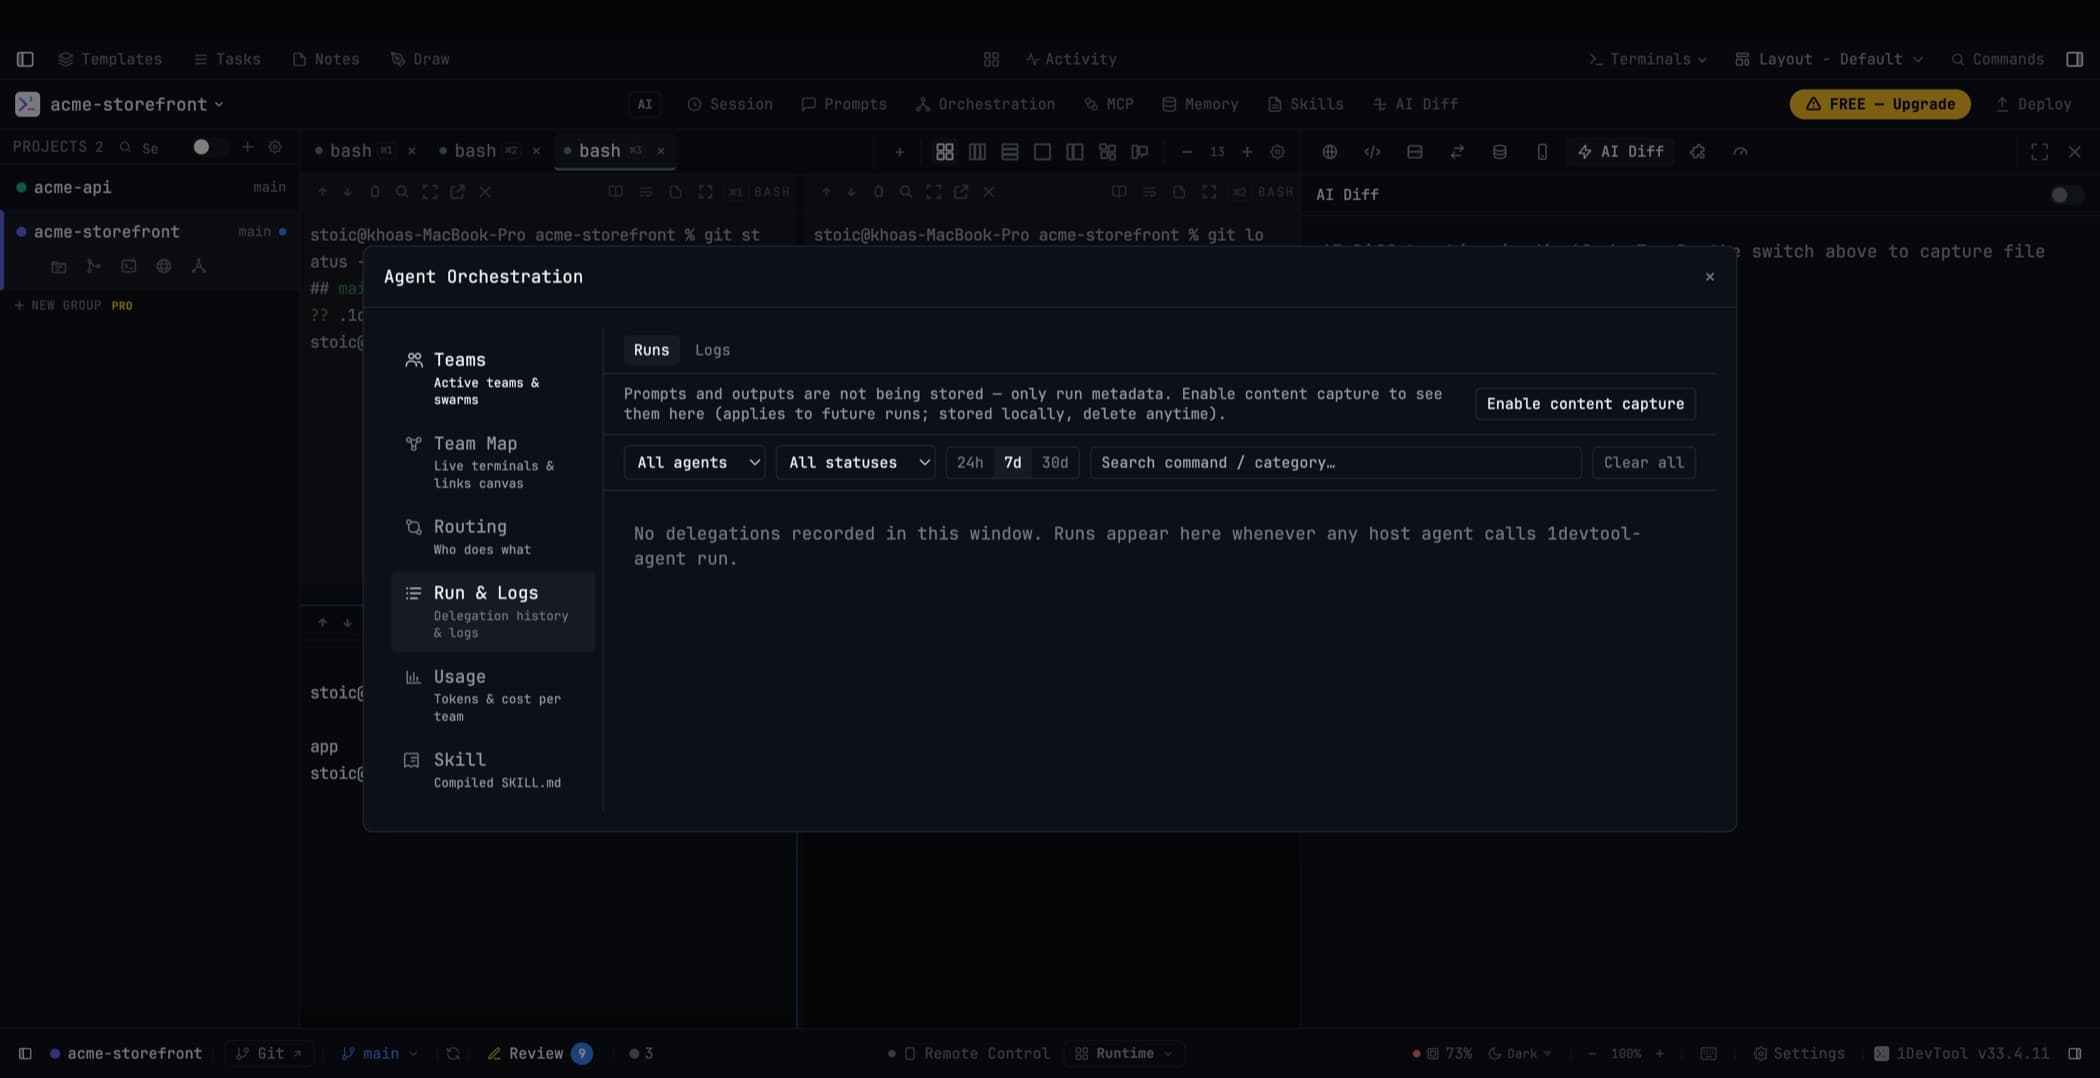
Teams
Active teams and swarms, with live status. Open a team's shared workspace to jump into its agents' terminals, pause or resume the worker pool, and cancel queued workers while letting running ones finish.
Projects running linked terminals are listed here too, with their participants, live link count, replies awaited, and a View map action — before, a project with three collaborating agents looked idle.
Team Map
The same graph you get inline in Mission Control: terminals as cards, links as edges, dragging to link, clicking an edge to unlink. See Team Map.
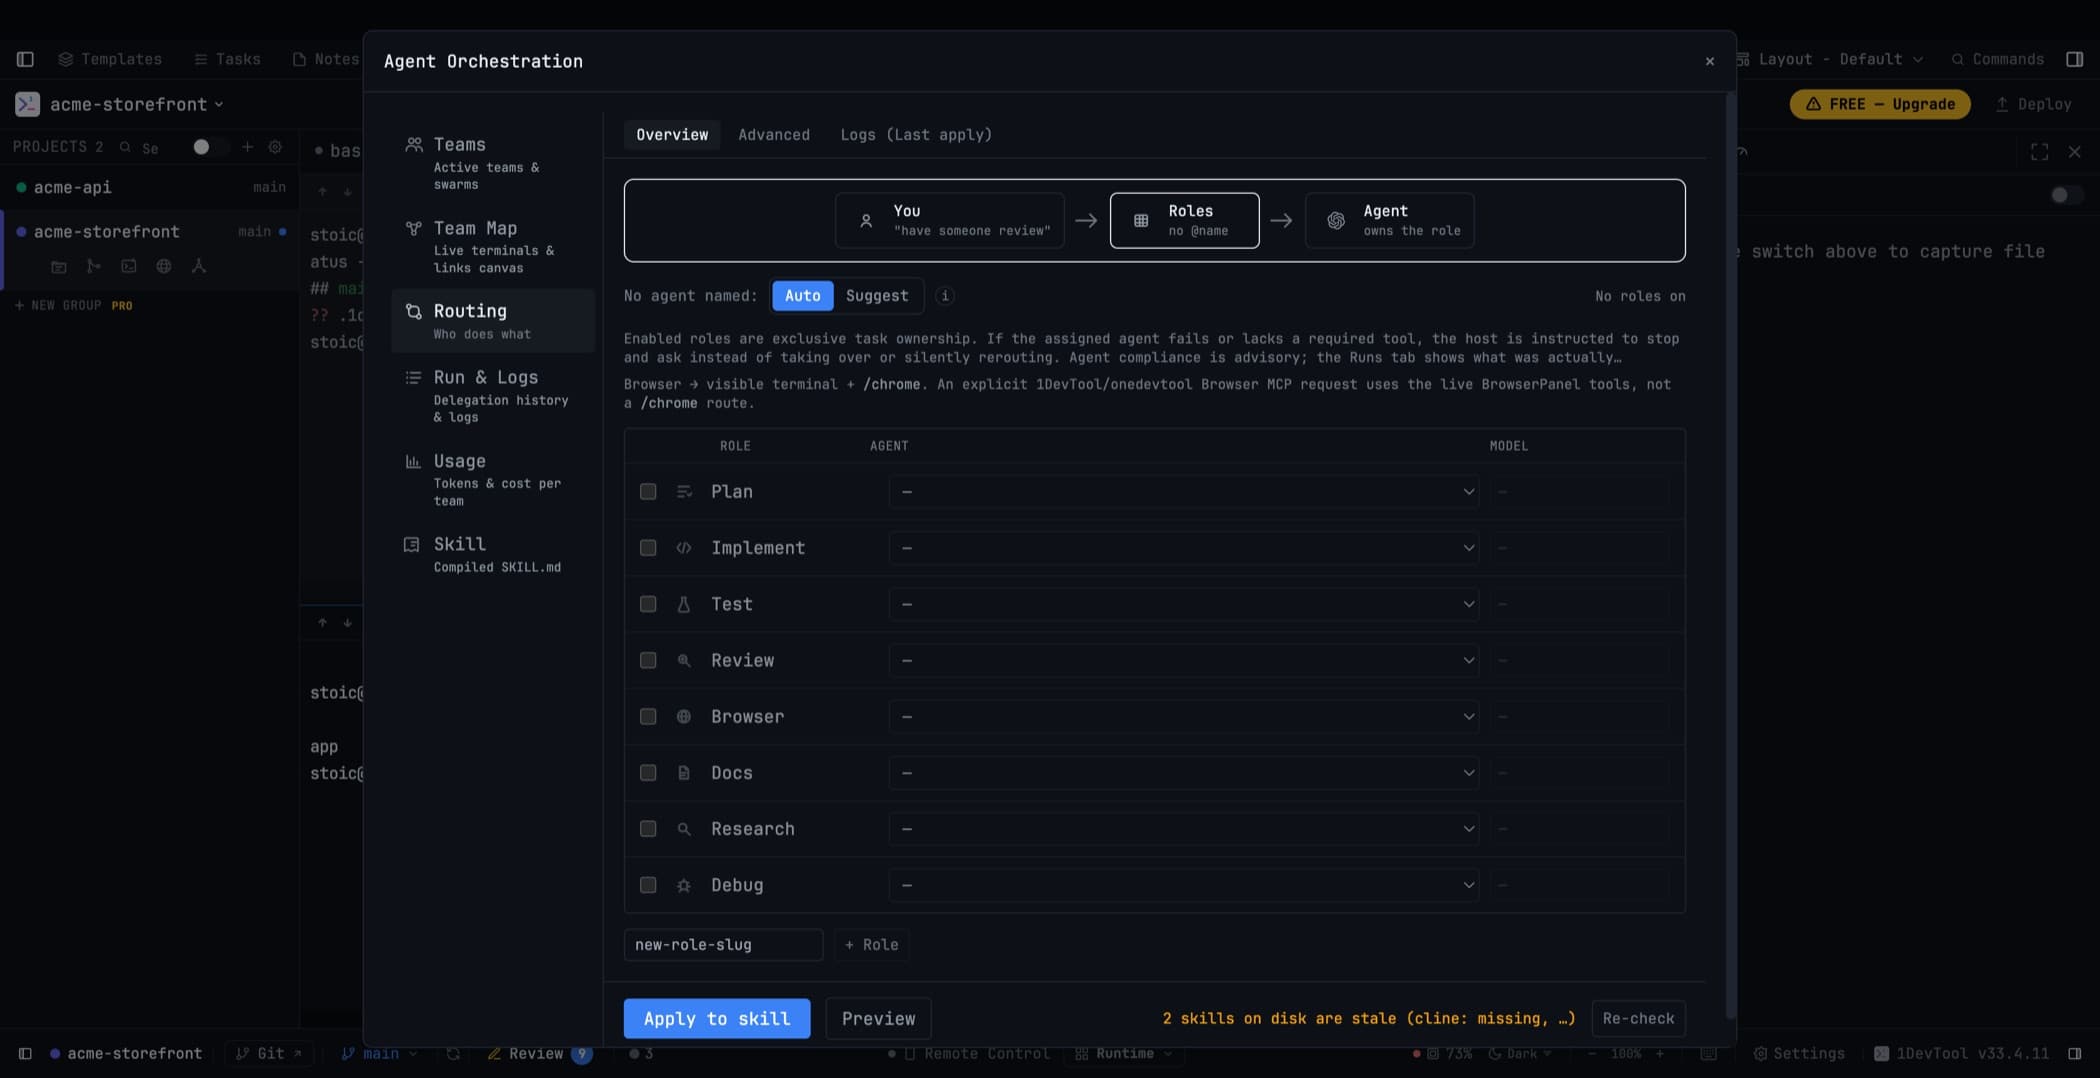
Routing
Routing is the table that decides which agent gets which kind of work. It explains the ownership rule your agents follow — one task, one owner — and shows the model catalogue each agent can be routed to.
Run & Logs
Runs and logs share one section. A run row tells you what was delegated, to whom, and how it ended; the log stream shows the output.
Logs group by team: runs nest under the team that produced them, and selecting a team header opens a merged stream that interleaves run starts, output, and the messages that travelled between members into one readable conversation. Logs are searchable, and warnings are visually separated from failures.
A run that failed before its agent ever started records why — agent not installed, sandbox unsupported, launch refused — so a failure is diagnosable instead of exporting as a bare "error".
Usage
Tokens and cost, grouped by team rather than only by agent. A team is named after its members (opus 5 + fable + codex), so a row means something without opening it.
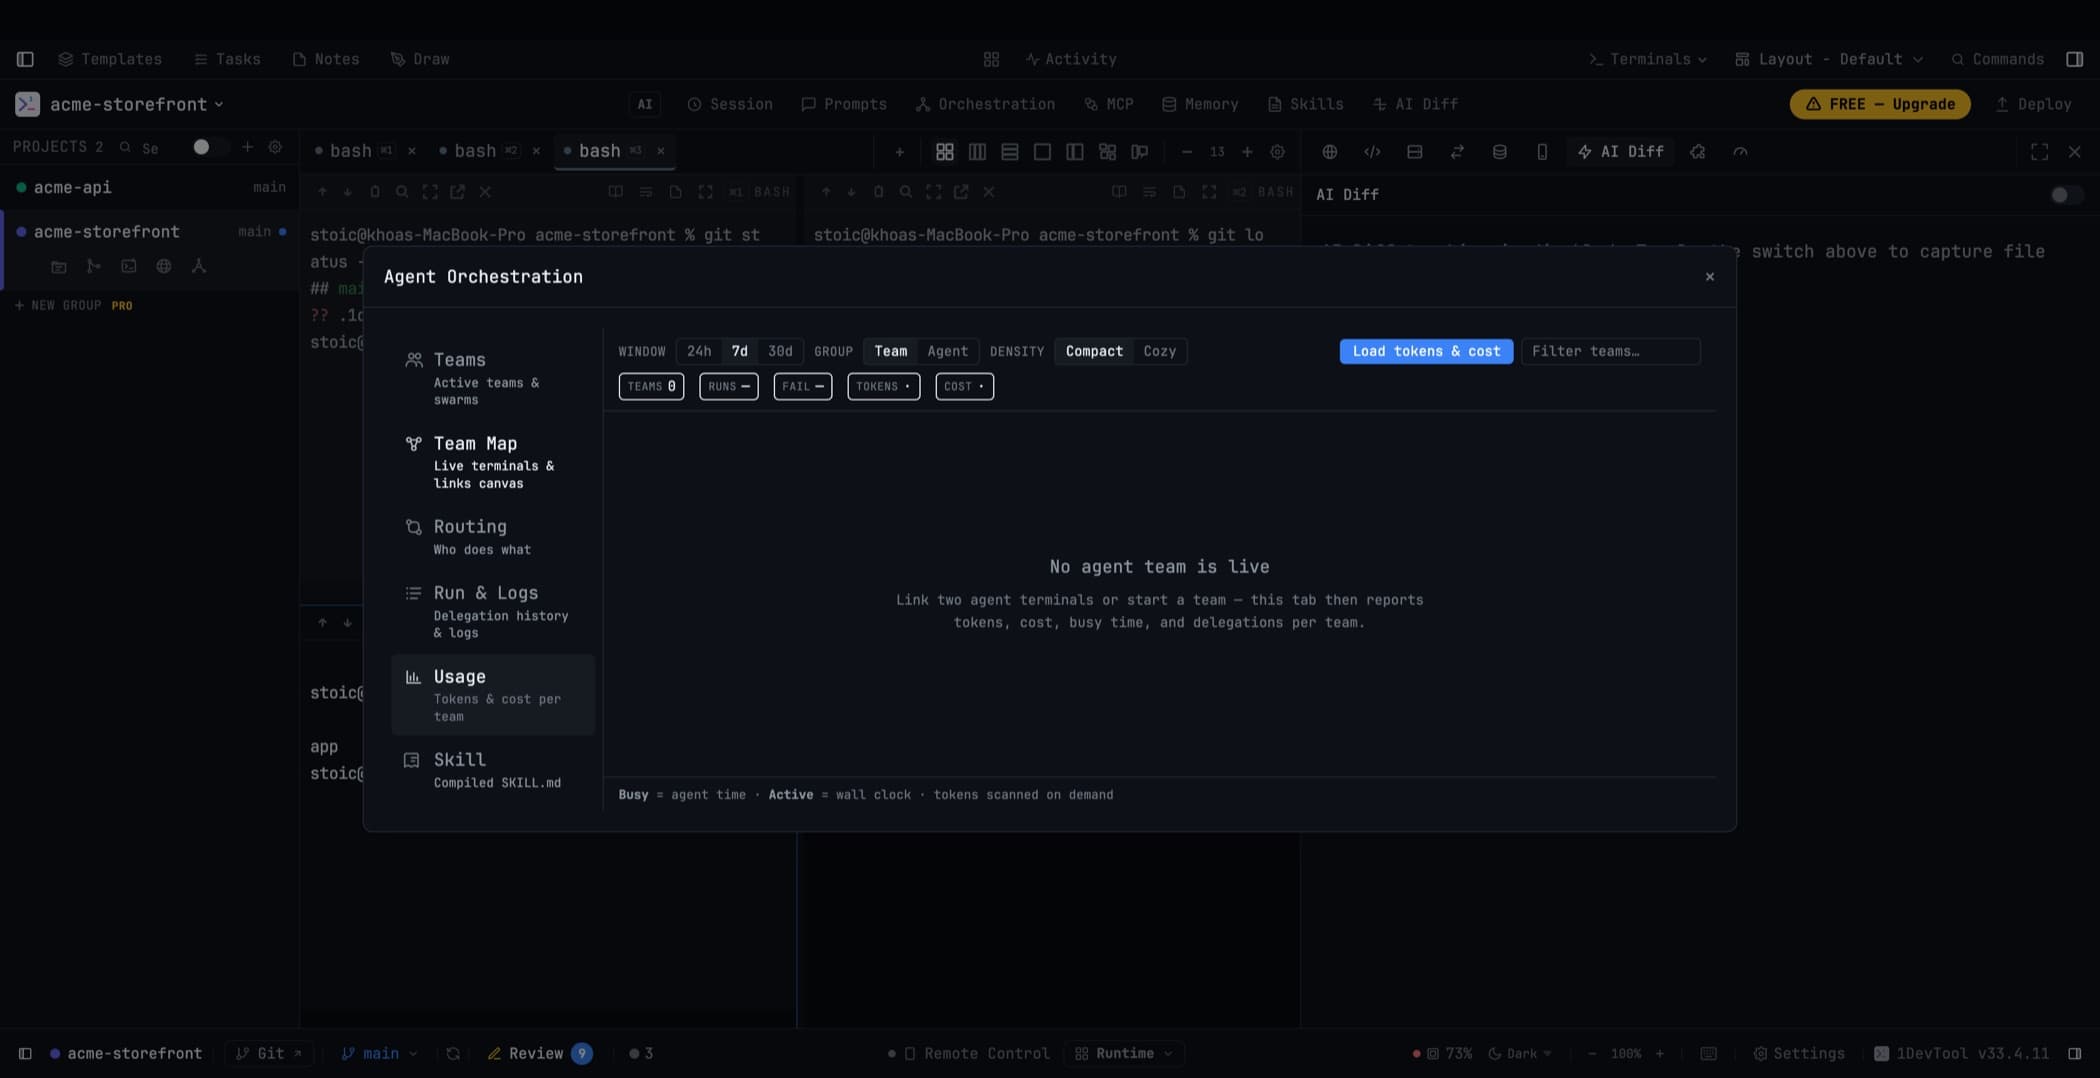
Things worth knowing about these numbers:
- Usage is attributed through captured session ids only. A member with nothing readable says
not trackedrather than showing a fabricated zero. - Sessions no live team claims stay visible as Not in a team, so the rows always add up to what the machine really spent.
- Busy (agent time, which can exceed the clock when agents work in parallel) and Active (wall clock since the team formed) are shown as the two different facts they are.
- Nothing is scanned until you press Load tokens & cost. Results are cached, stamped "tokens as of HH:MM", and have a Rescan beside them. Opening this tab never launches an agent CLI you did not ask for.
Expand a team to break it down per member, and click a member's tokens to jump to that terminal.
AI Diagnosis
Under Advanced → AI Diagnosis, a checker AI reads a stuck terminal's screen, says what is wrong, and lets seats with backups switch over. Autopilot can resume an agent that crashed or dropped its connection mid-task. See AI Diagnosis & Autopilot.
Skill
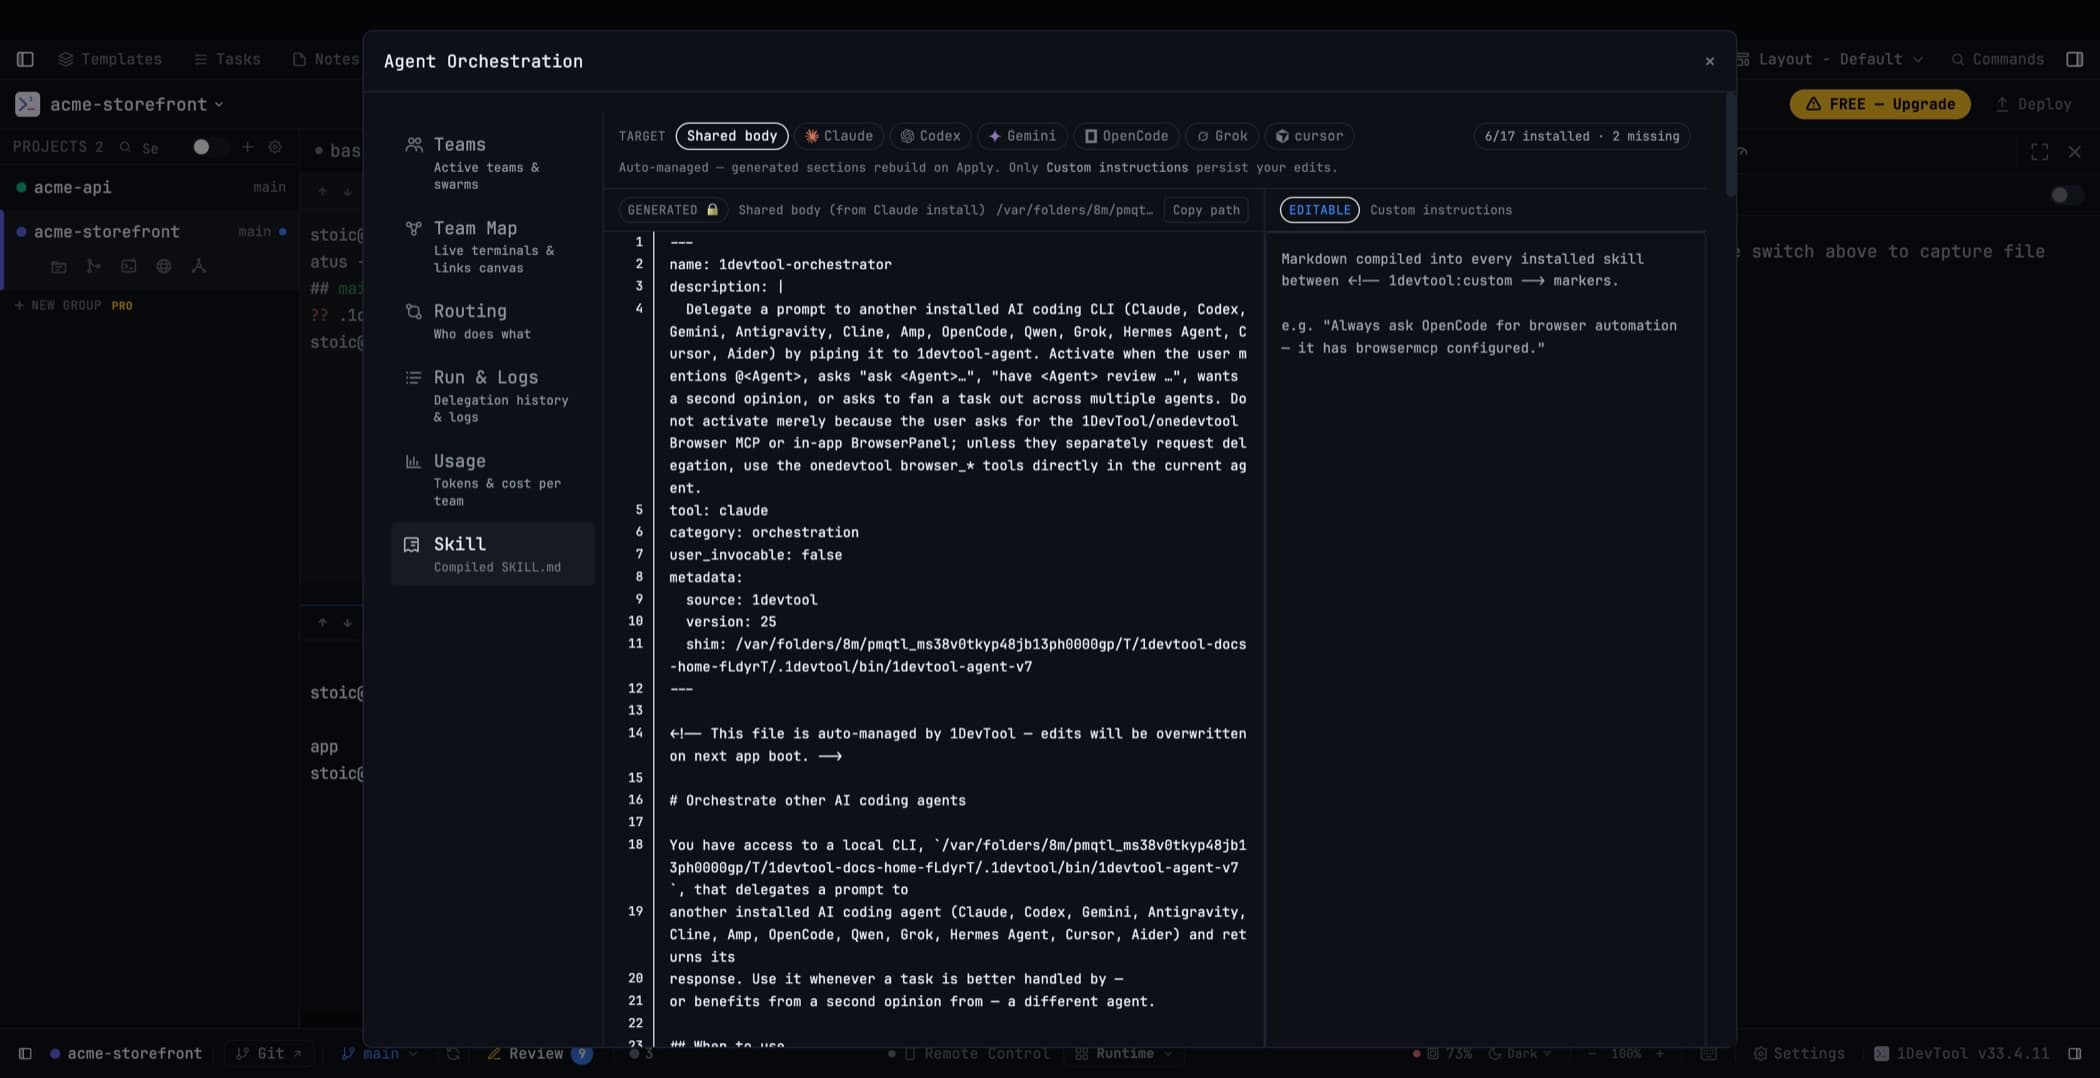
The compiled SKILL.md your agents are actually given — the instructions that teach them how to delegate, how to reply, and which swarm targets are supported. Reading it is the fastest way to understand what your agents believe about orchestration. It refreshes on the next app start after a change.
Related
- Mission Control — the live view
- Agent Teams & Swarms — starting the work this dashboard records
- AI Usage & Quota — per-provider quota, separate from per-team cost