Analytics
A local recap of your agent work — sessions, prompts, agent time, tokens, estimated spend, orchestration runs and git output — plus shareable recap cards. Nothing is uploaded.
Analytics reads the activity trail already on your computer — the prompts you typed, the agent sessions you ran, the tokens they used, your orchestration runs and your git history — and turns it into a recap you can scope by time, project and agent. It is computed locally and nothing is uploaded; the header says so with a Local only chip.
Opening Analytics
- Press
Cmd+Shift+Aon macOS, orCtrl+Shift+Aon Windows and Linux. - Choose Navigate → Analytics… from the app menu.
- Run Open Analytics from the Command Palette.
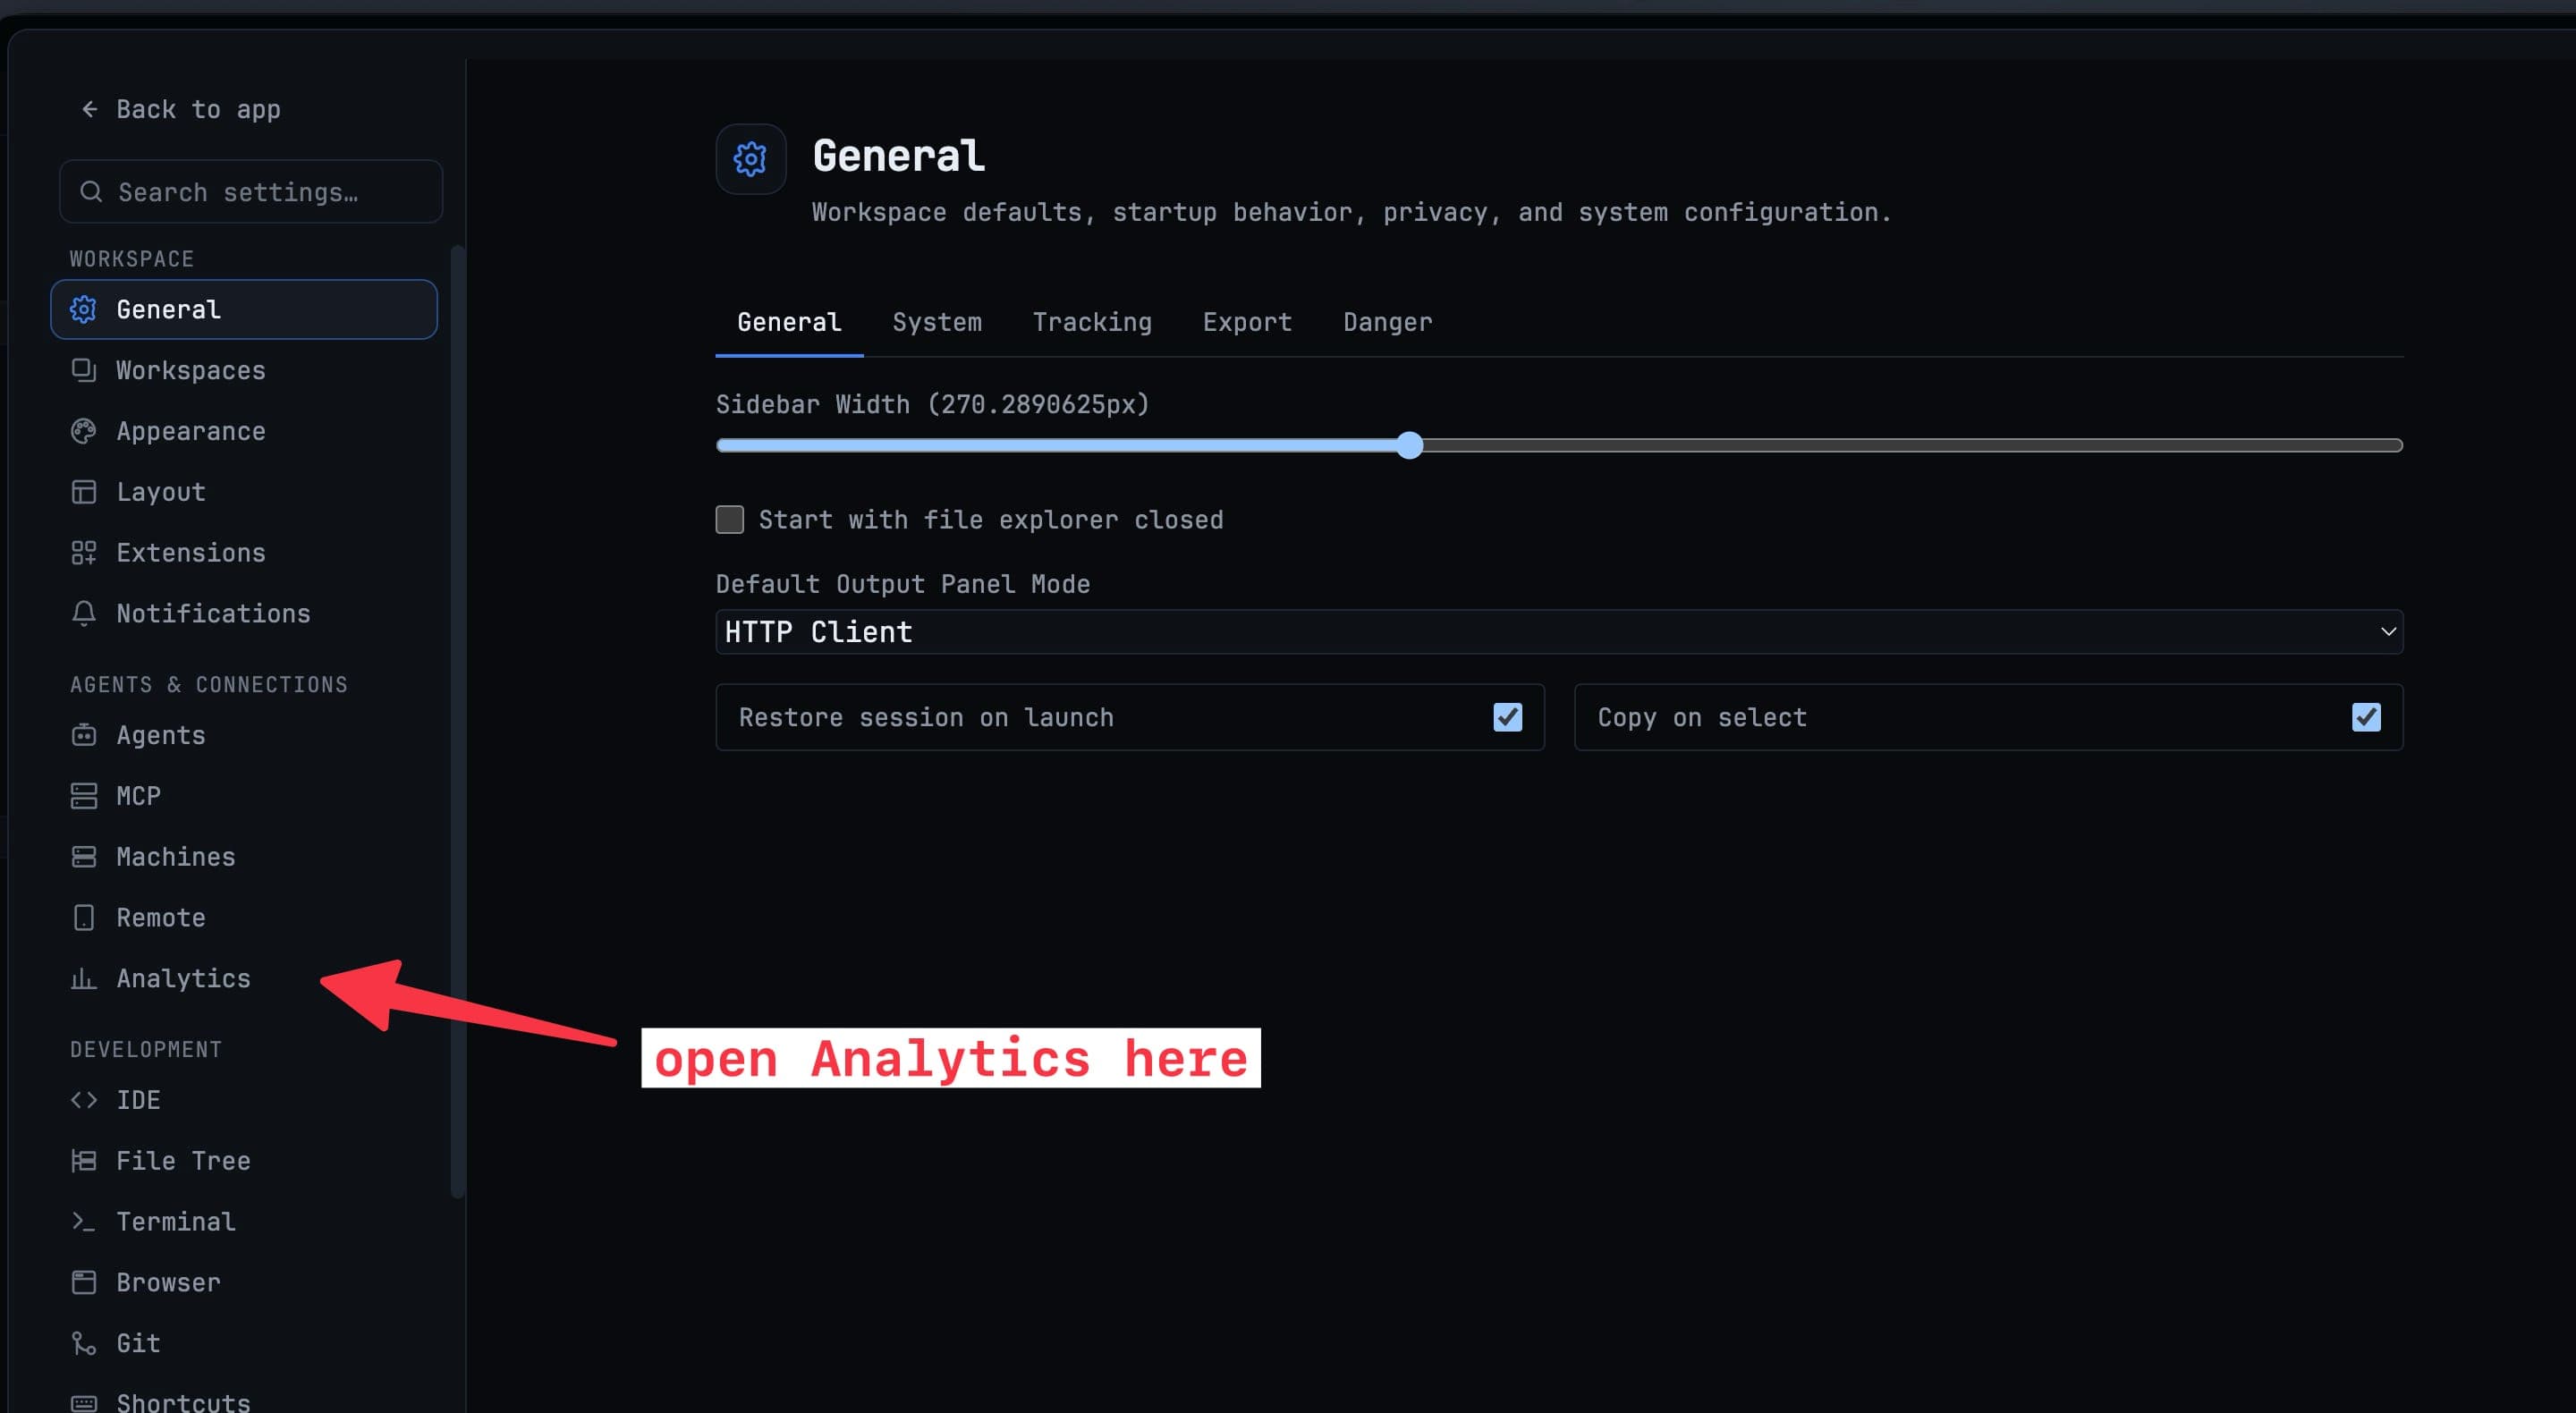
- Click Open Analytics in Settings → Analytics.
There is also a top-bar Analytics button. It is off by default — switch it on under Settings → Layout → Top Bar.
Range, project and agent
The toolbar holds four tabs — Overview, Agents, Sessions, Projects — and the controls that scope all of them:
- 24h, 7d, 30d, 90d, All — the time range. It opens on your default range (7d unless you change it); a range picked inside the dialog lasts until you close it.
- All projects and All agents — narrow everything to one project or one agent. Agents show their brand logos and projects their avatars.
- Refresh — recompute the current view.
Long ranges stay readable: charts roll up from days to weeks to months instead of drawing a bar for every day.
Overview
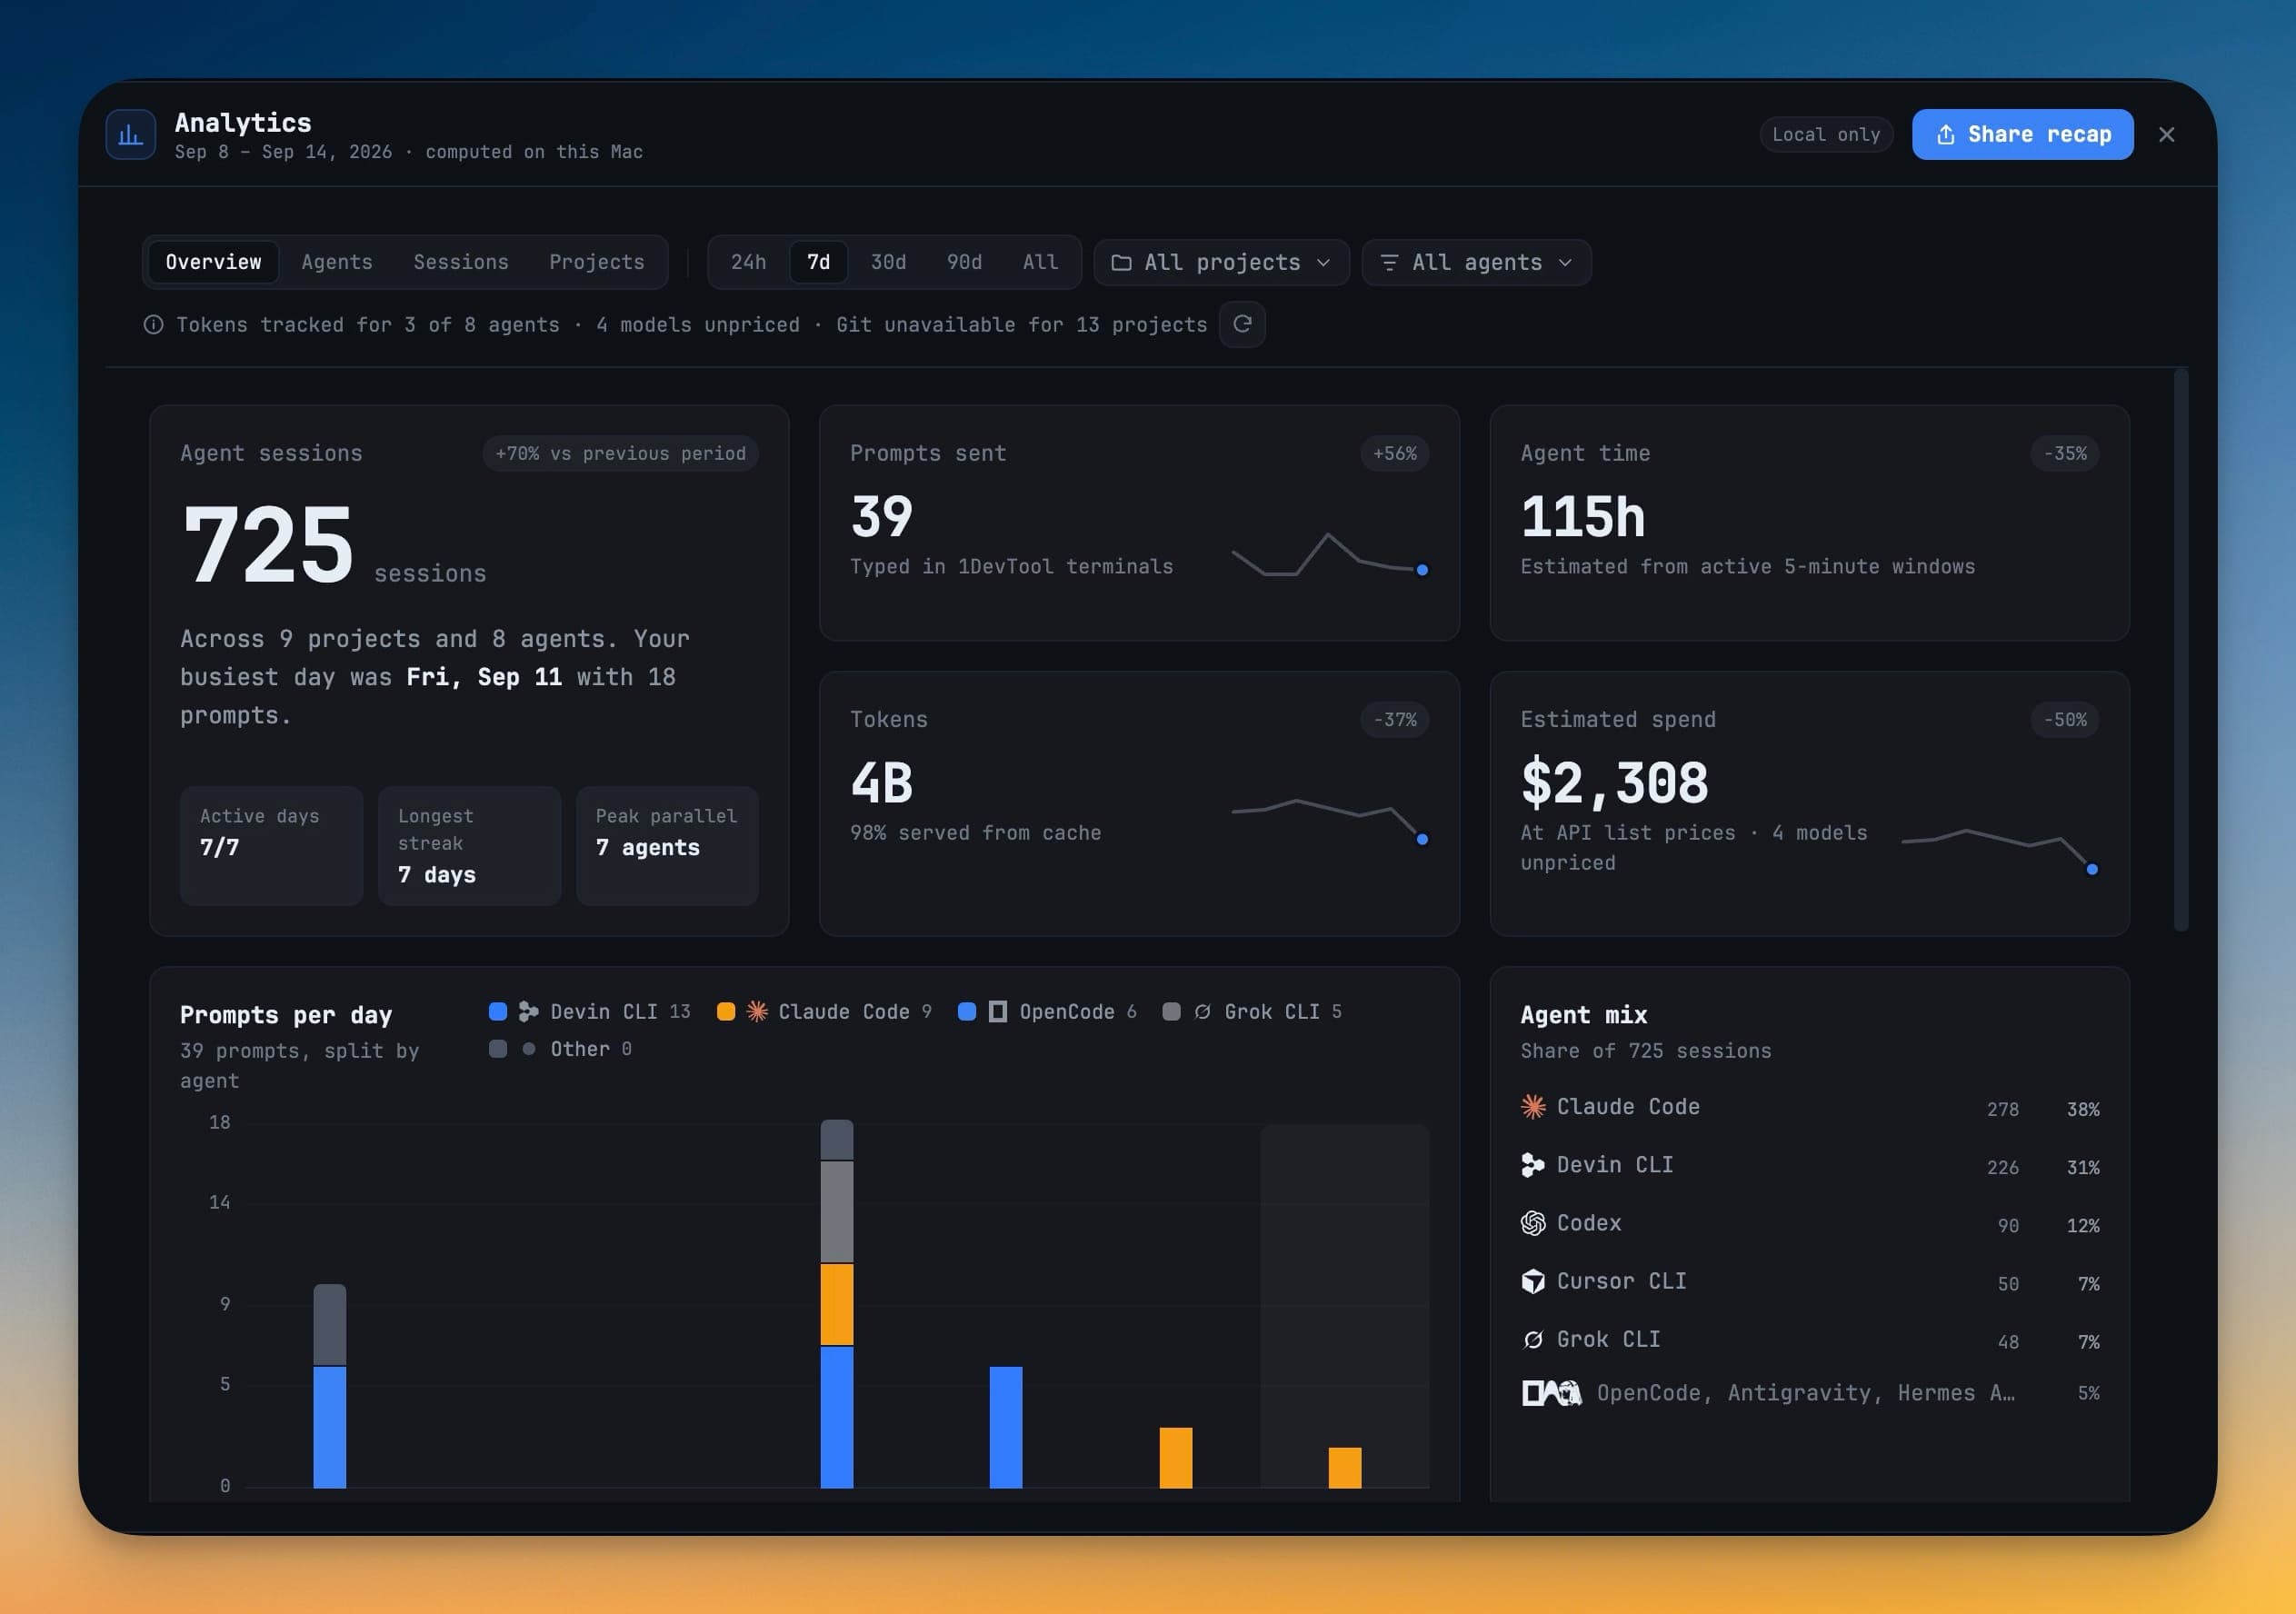
The top row sums up the period:
- Agent sessions — the count, the change against the previous period, and Active days, Longest streak and Peak parallel (the most agents running at the same moment).
- Prompts sent — prompts typed in 1DevTool terminals.
- Agent time — estimated from active 5-minute windows, so a tab left open overnight does not count as work.
- Tokens — with the share served from cache.
- Estimated spend — at API list prices.
Below it: Prompts per day stacked by agent, Agent mix (share of sessions per agent), When you work (a weekday × hour punchcard), Top projects, Shipped and Longest sessions.
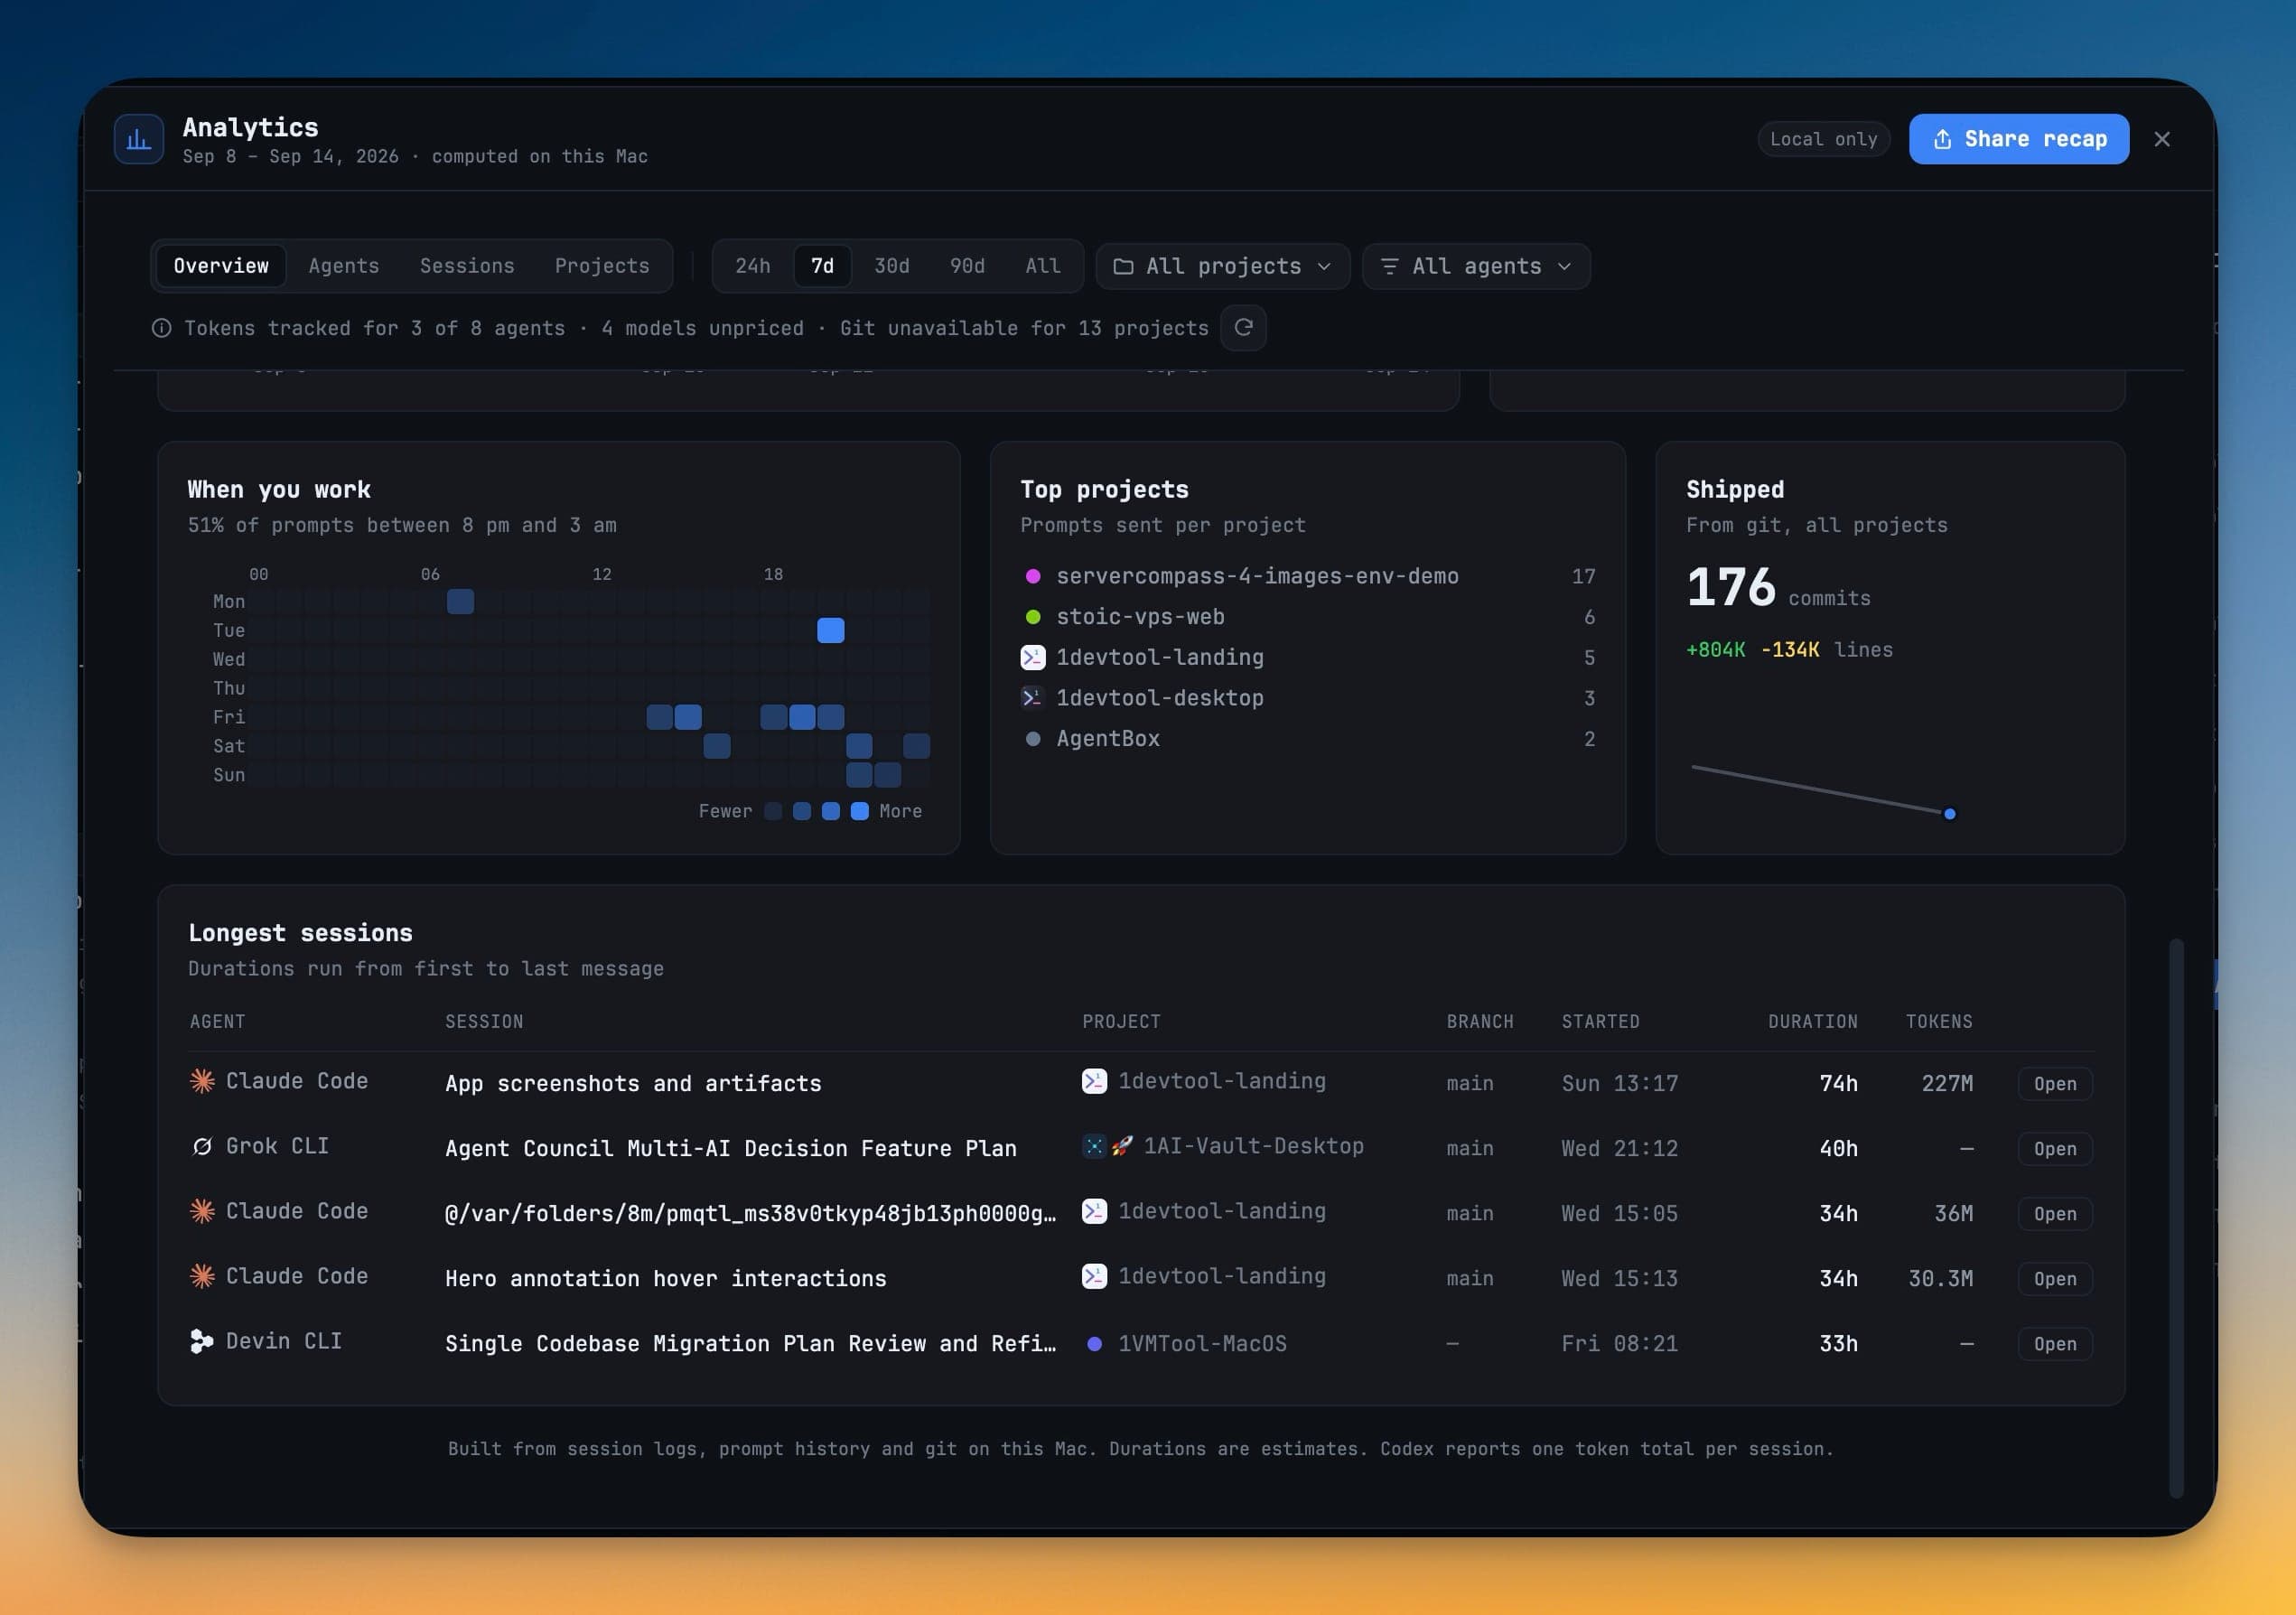
Shipped counts commits and lines added and removed from git, per project, for commits authored with the repository's configured user.email. Merge commits are left out, and a commit that appears in several worktrees is counted once.
Agents
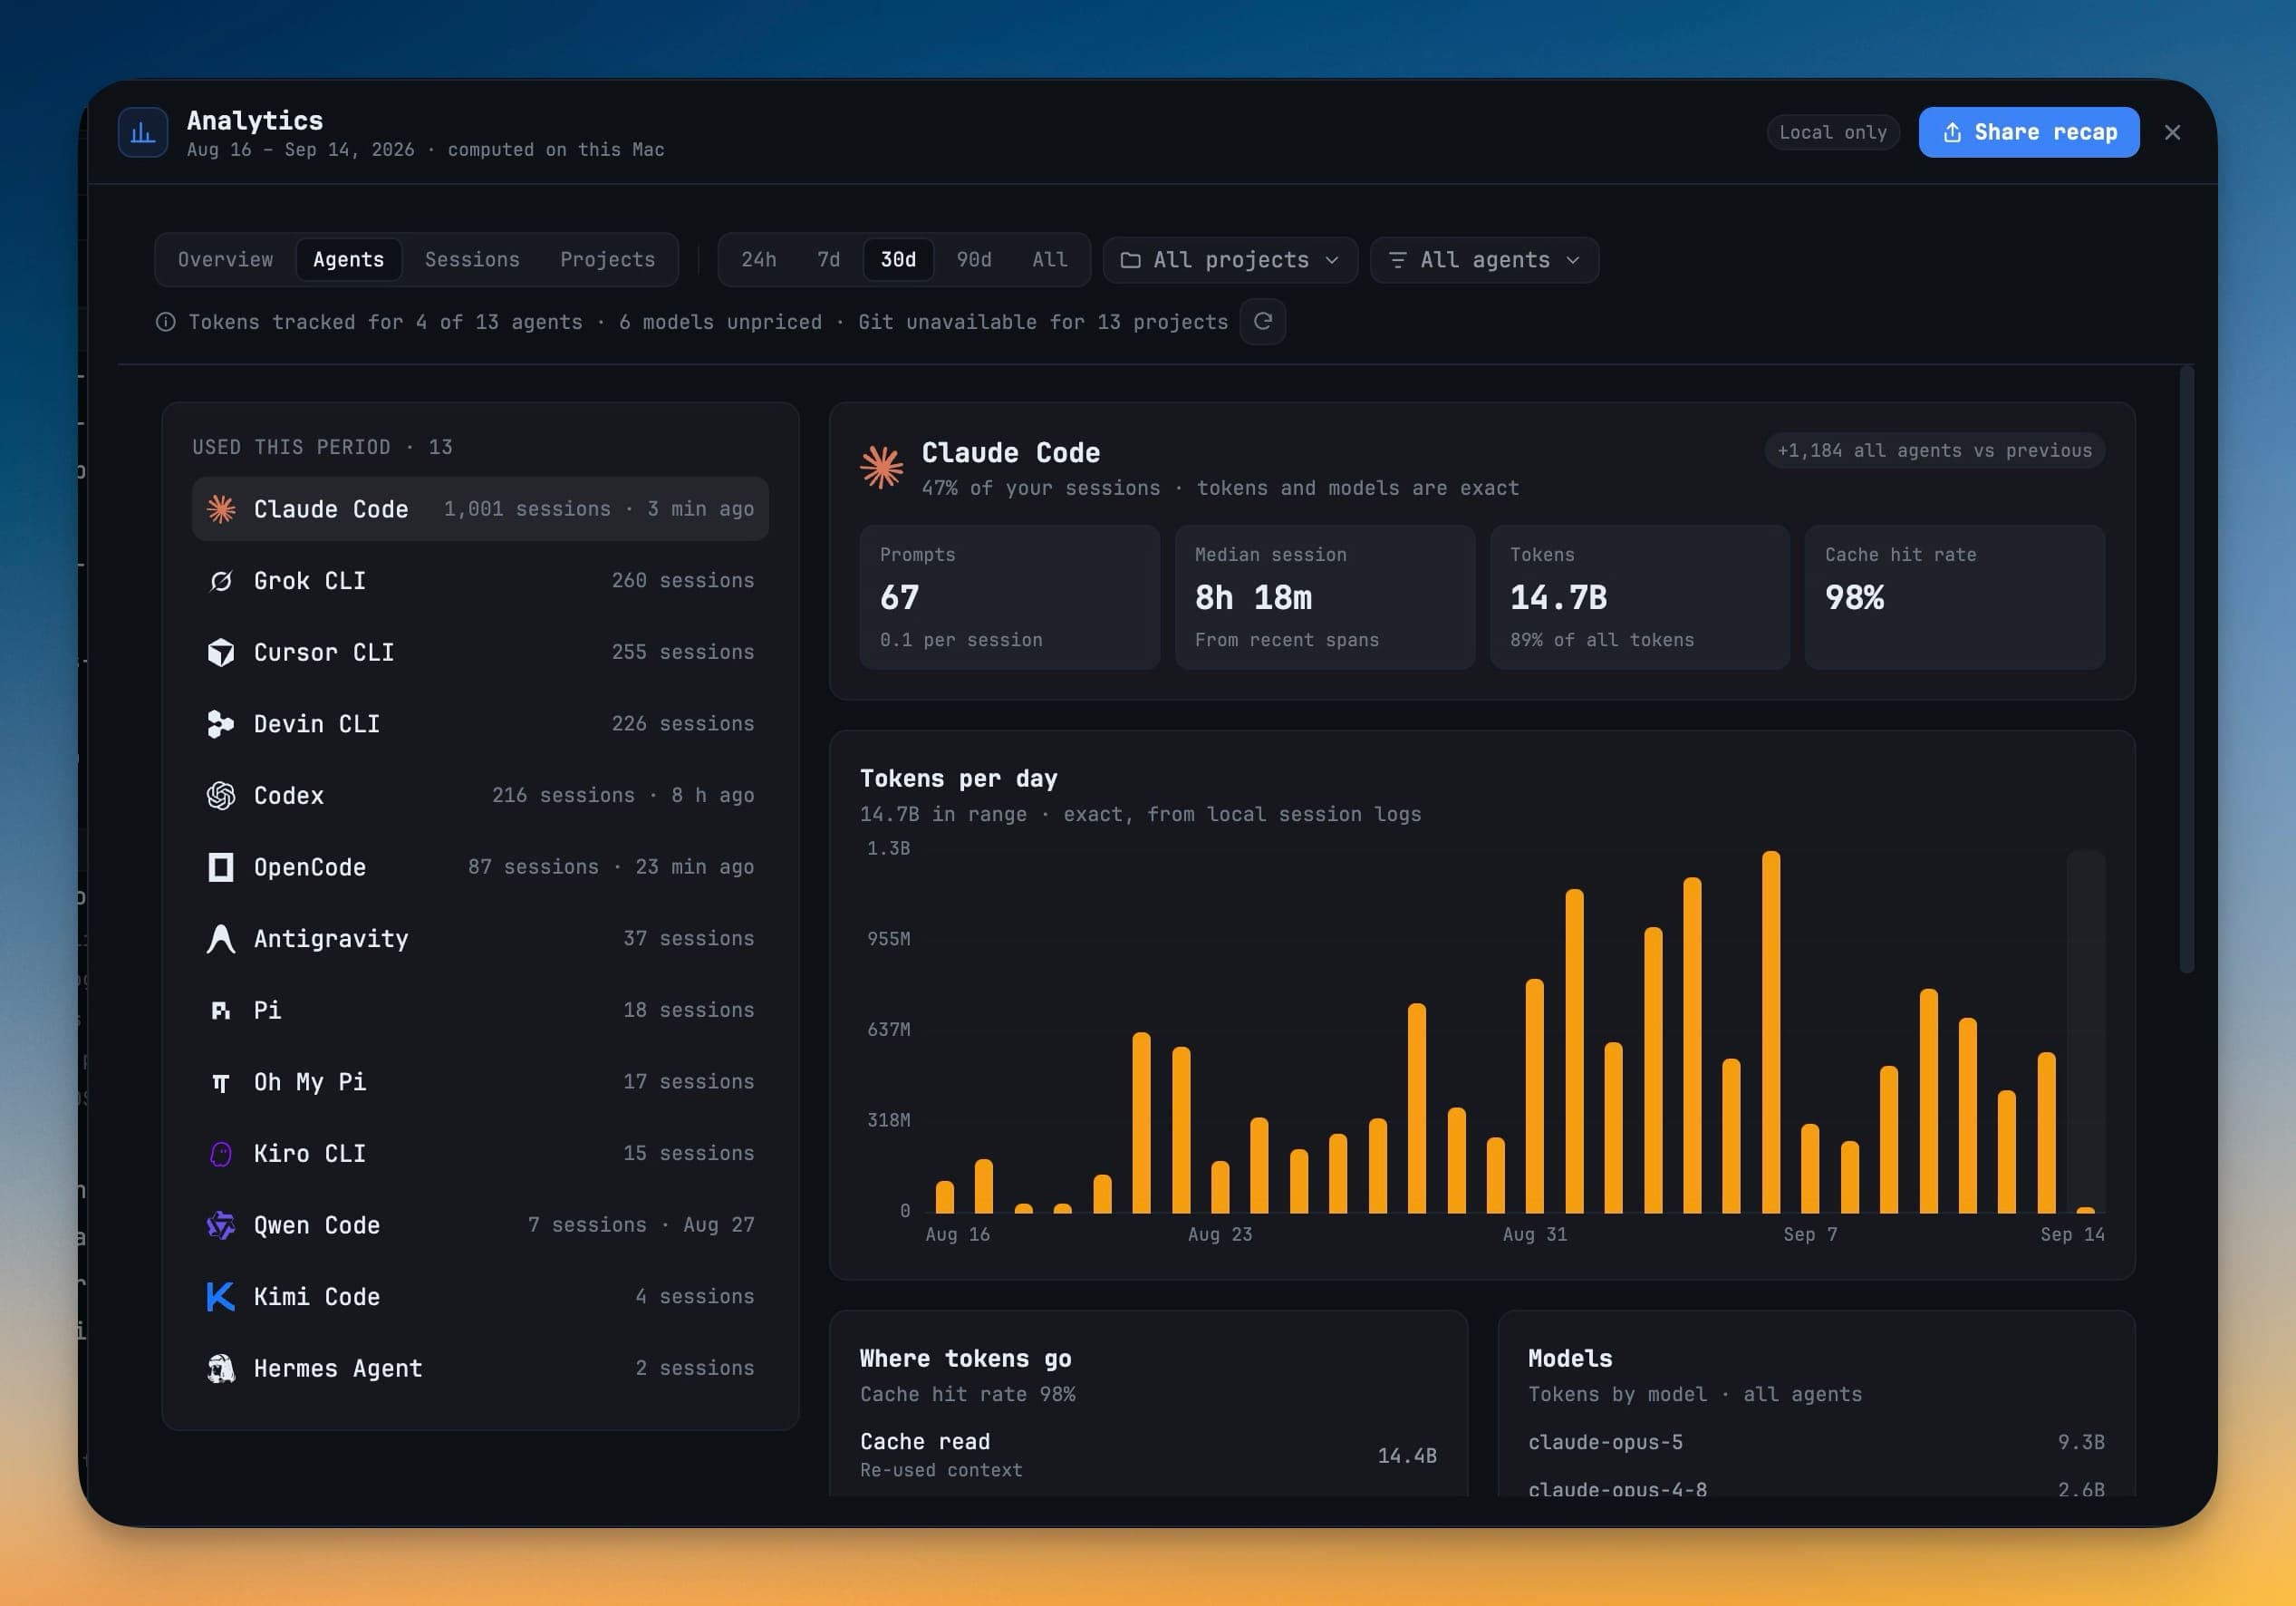
The left rail lists every agent Used this period, with its session count, and the ones not used. Select an agent to see:
- Prompts, Median session, Tokens and Cache hit rate.
- Tokens per day — exact, from the agent's local session logs.
- Where tokens go — Cache read (re-used context), Cache write (new context stored), Output (what the agent wrote) and Input (uncached prompt text).
- Models — tokens by model. A model with no known list price is marked with a warning, because spend for it is understated.
- Recent sessions.
Sessions
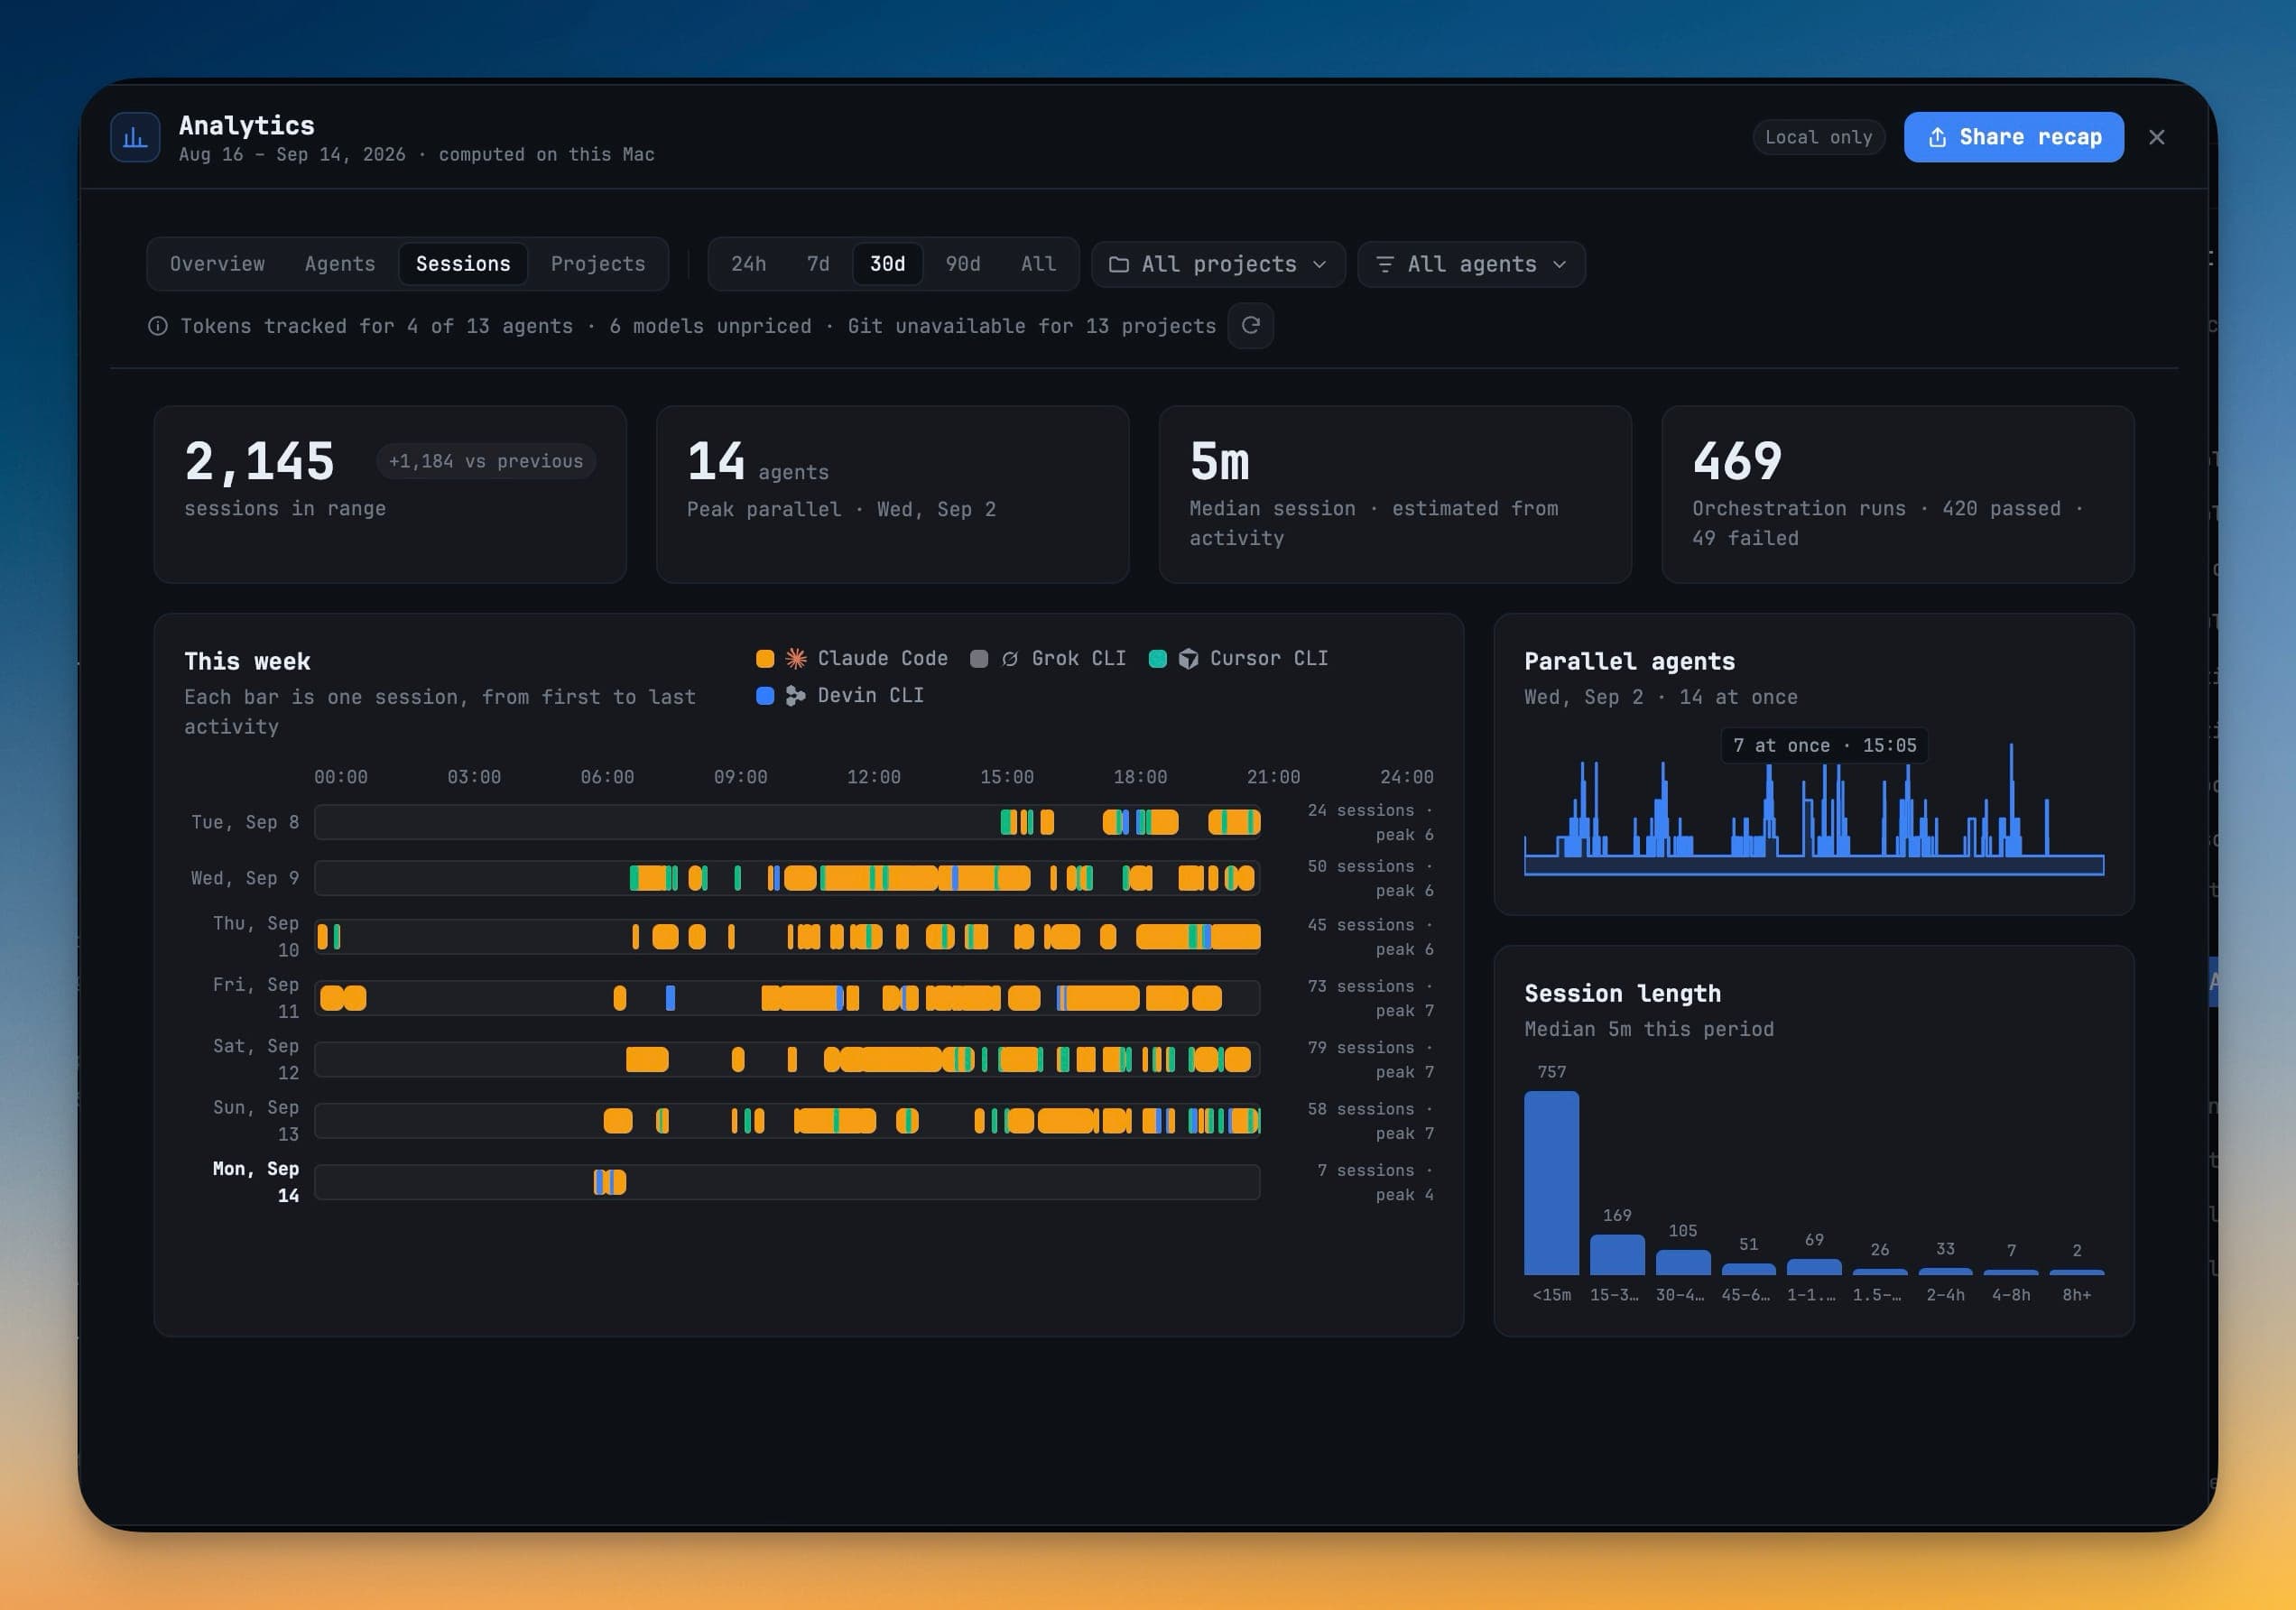
- Totals for sessions in range, Peak parallel, Median session and Orchestration runs, split into passed and failed.
- This week — a timeline where each bar is one session, from first to last activity.
- Parallel agents — how many agents ran at once, and when the peak happened.
- Session length — a histogram of session durations.
Select a session to see its project, branch, model, span, tokens and first prompt. Copy resume command puts the command that resumes it on your clipboard.
Inspecting one session
The Sessions table lists every session in range and can be filtered by title, project, agent or session id, then sorted by start, span, tokens, tools, MCP calls or skills.
Open a session and you get where it actually went:
- Where tokens go — the bill split into input, output, cache and reasoning, plus an estimate of tool-turns against plain text-turns.
- The tools it ran, the MCP servers it called and the skills it fired.
- A pill saying how complete the scan was, rather than a total that quietly under-reports.
Pick a second row to compare two sessions side by side.
An Orchestrate view grades team, swarm and headless runs in range — pass rate, timeouts and interruptions, median and p90 duration, tokens burned — with plain-language observations instead of a score.
Projects
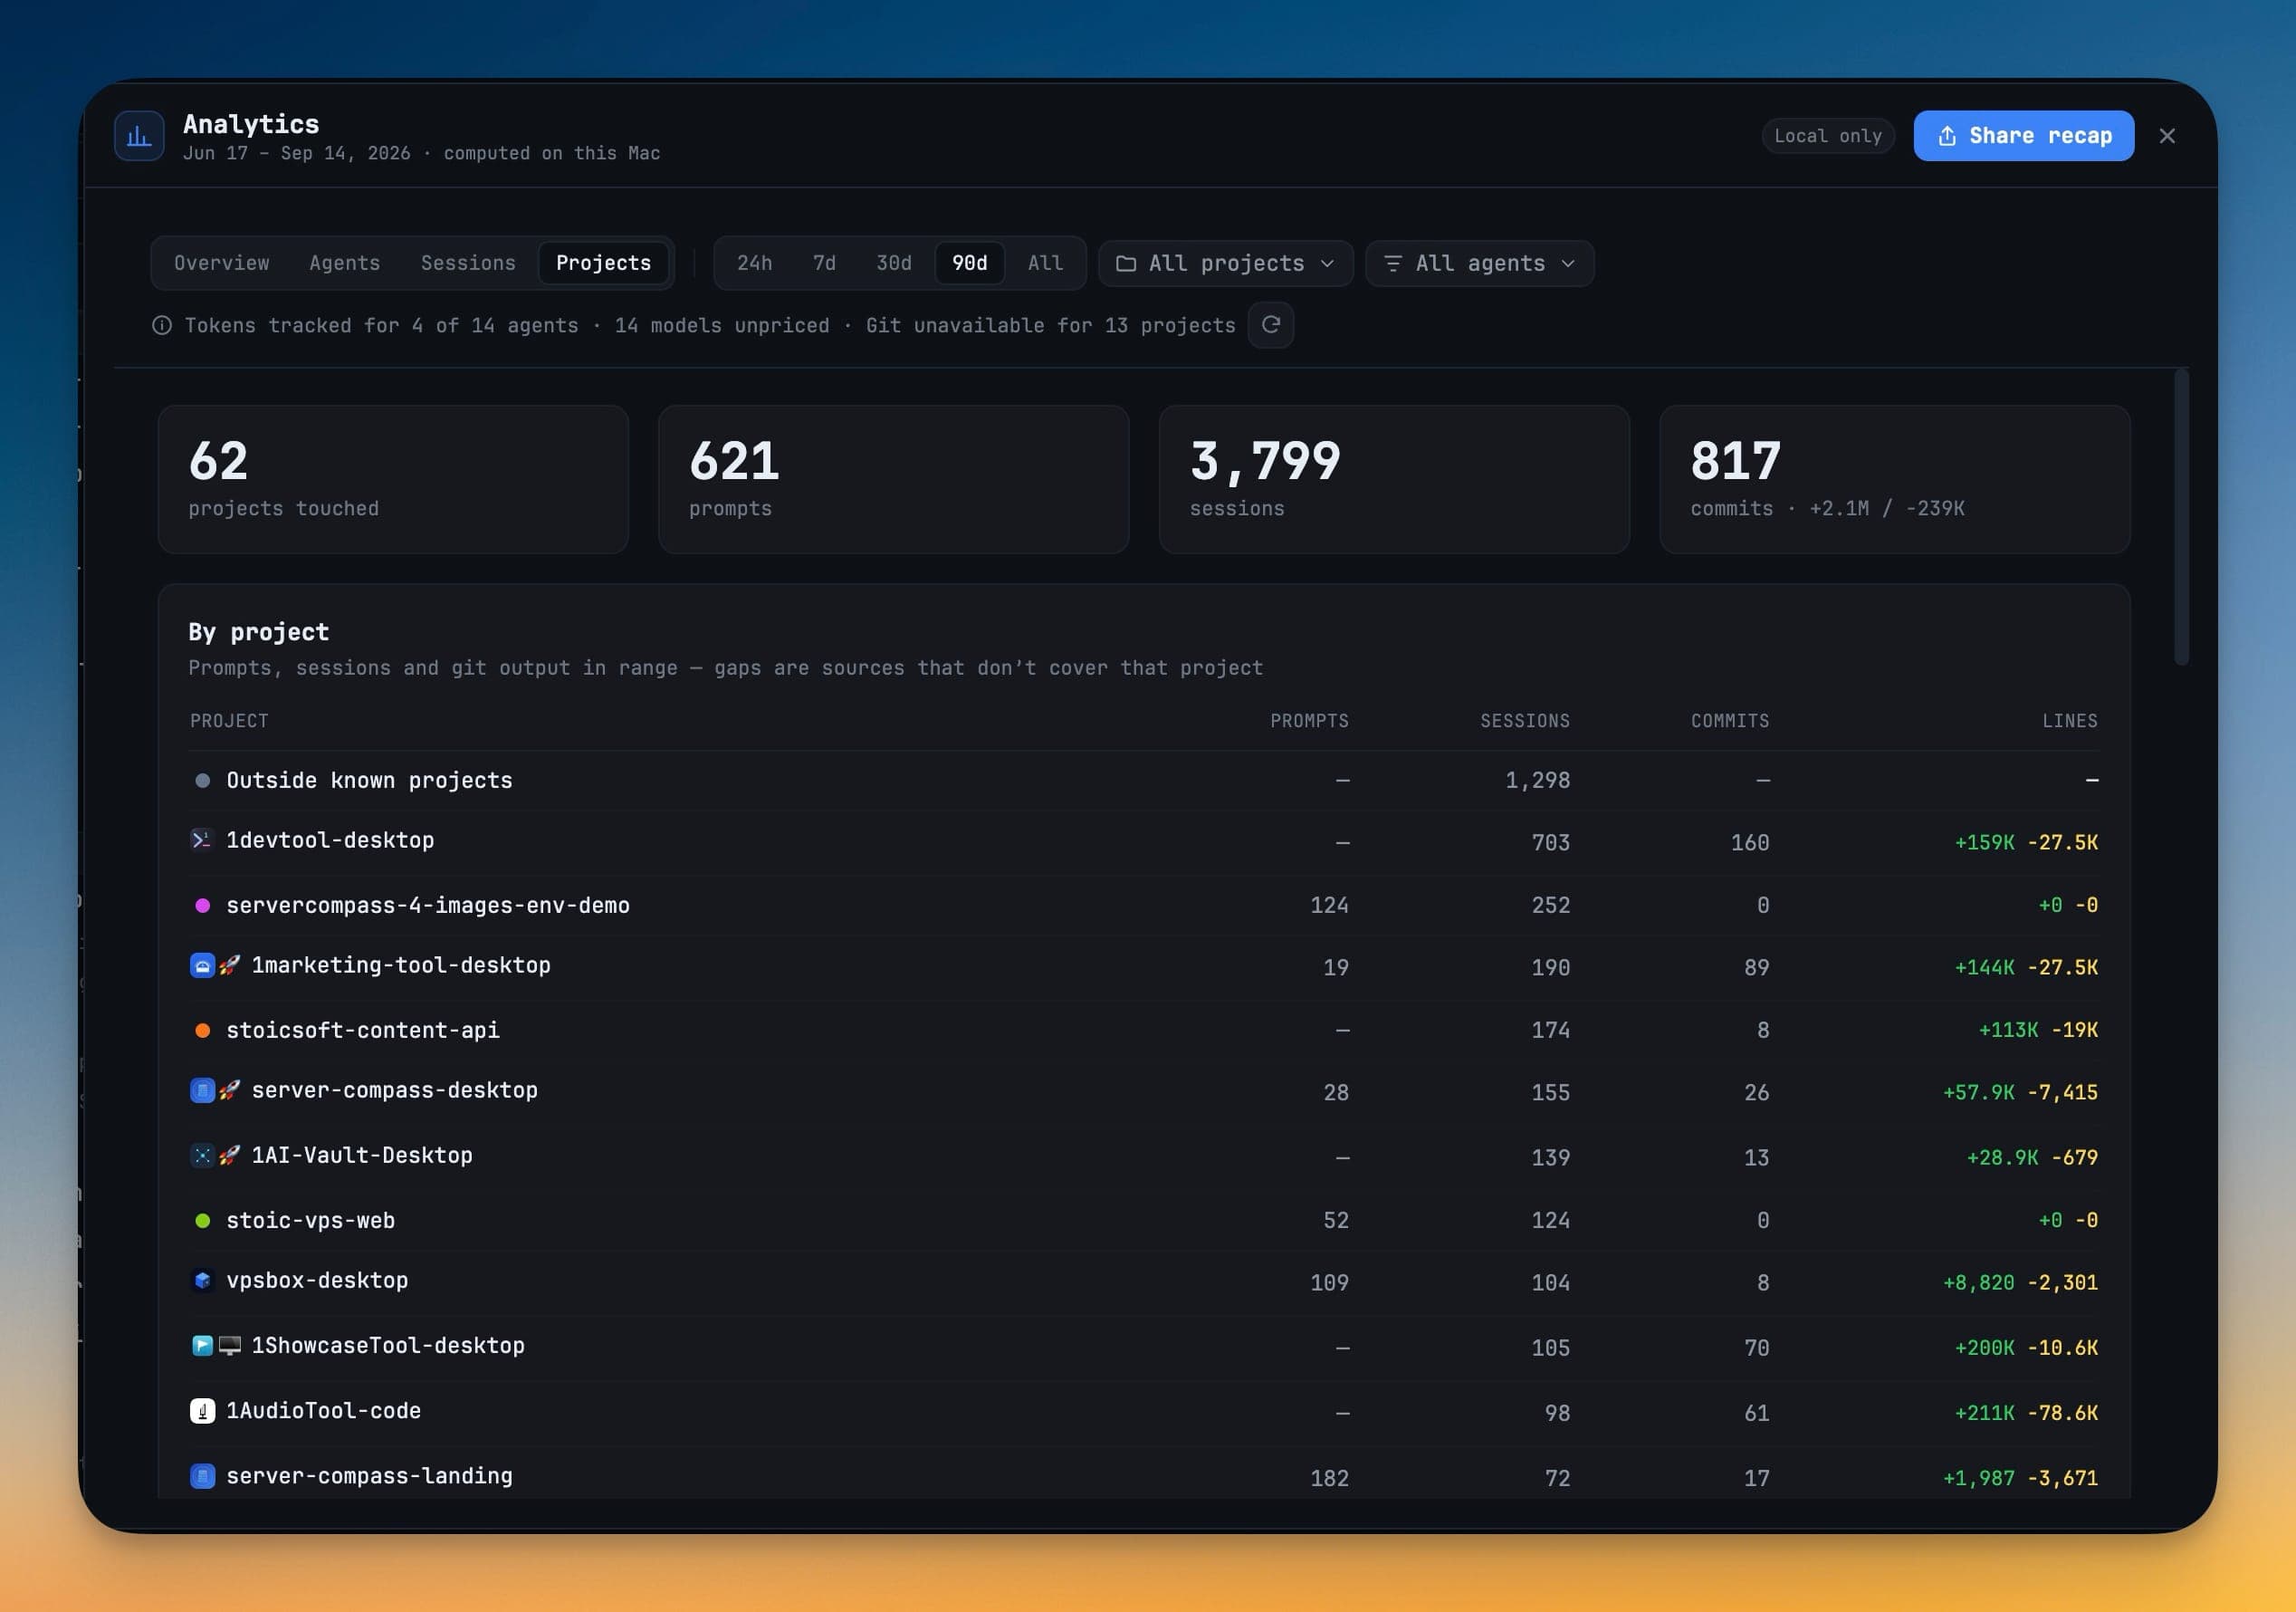
Totals for projects touched, prompts, sessions and commits, then a By project table with prompts, sessions, commits and lines for each project in the range. A project tagged git unavailable or git partial is one git could not fully cover — the gap is a missing source, not zero work.
What the numbers are built from
| Number | Source |
|---|---|
| Prompts | Your 1DevTool prompt history |
| Sessions | The same local session index that powers Resume |
| Tokens and models | Session logs written by Claude Code, Codex, Gemini, Qwen and OpenCode |
| Estimated spend | Those tokens at API list prices |
| Orchestration runs | Your recent orchestration run history |
| Shipped | git log for each project |
Codex reports one token total per session, so its per-day token chart is session-granular rather than exact per message.
Coverage is shown, not hidden
When a source does not cover part of the view, a line under the toolbar says so — for example Tokens tracked for 3 of 8 agents · 4 models unpriced · Git unavailable for 13 projects. Missing data is left out rather than drawn as a zero, and anything estimated says it is an estimate.
Opening is instant, closing is free
Analytics opens on the last computed snapshot and refreshes behind it. Closing the dialog cancels any work in flight, and nothing is computed while it is closed.
Share recap
Share recap in the header turns a period into an image.
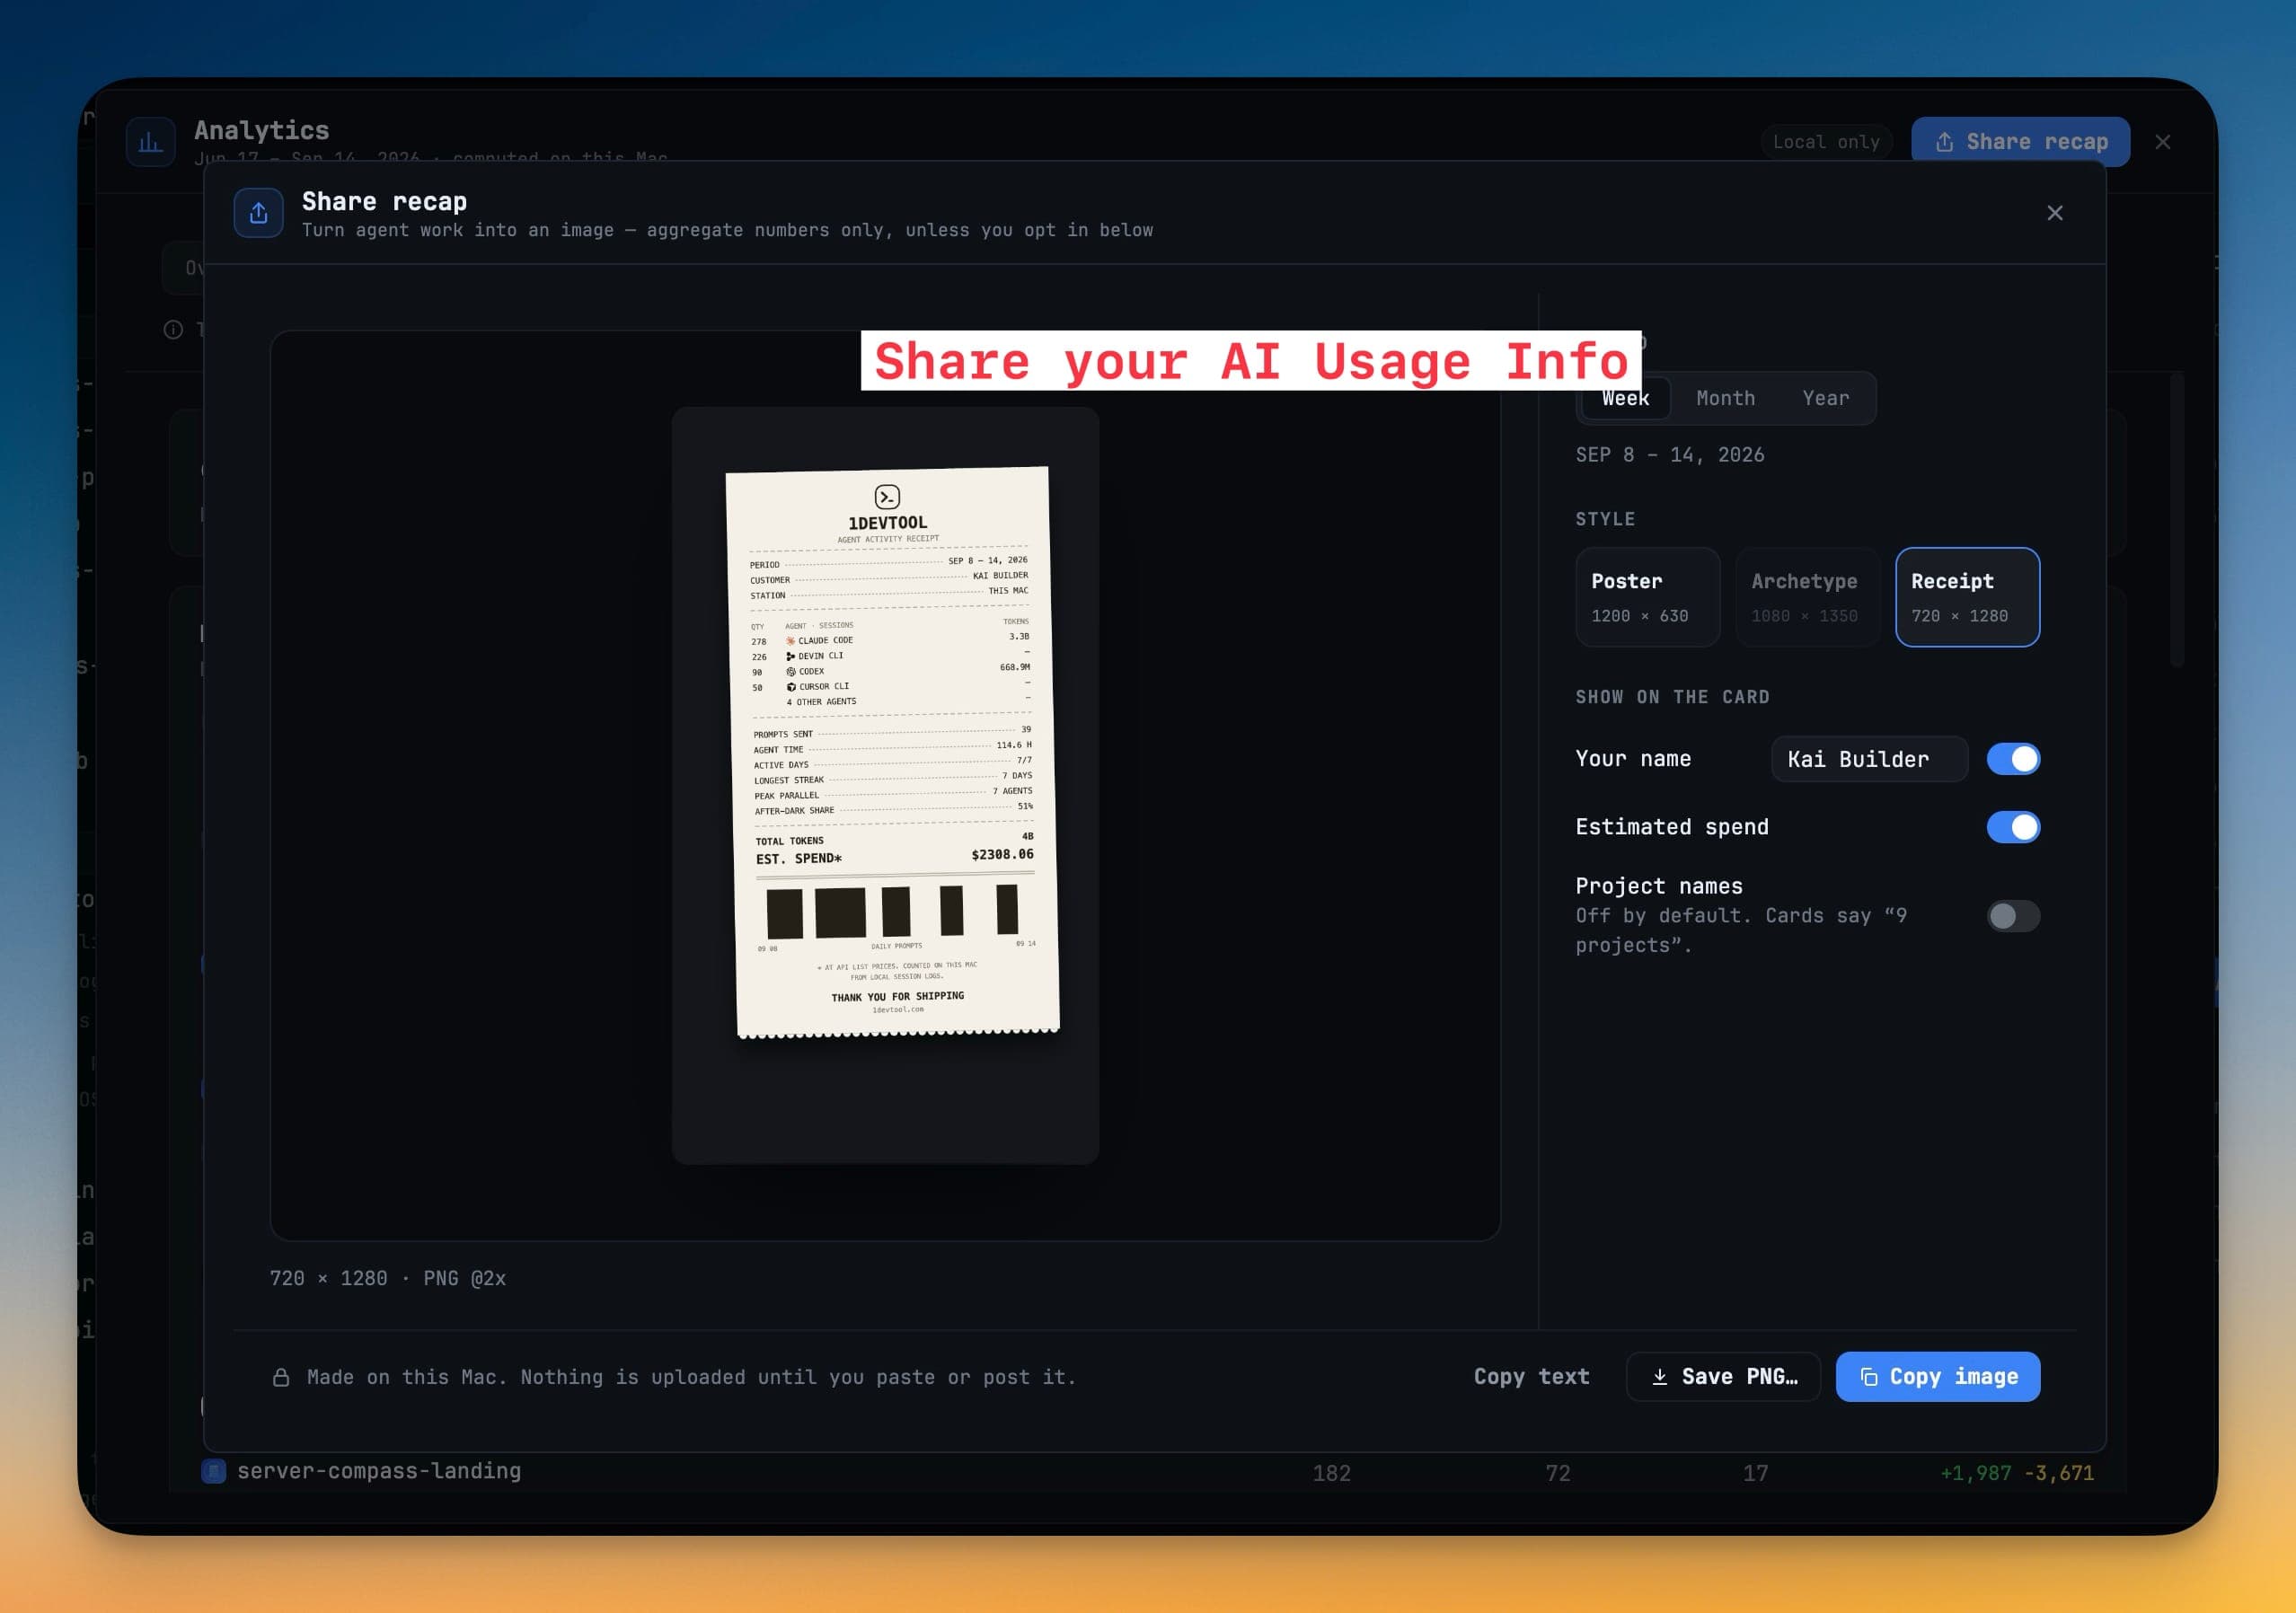
- Pick a Period: Week, Month or Year — the last 7, 30 or 365 days.
- Pick a Style: Poster (1200 × 630), Archetype (1080 × 1350) or Receipt (720 × 1280). Archetype names your coding archetype and needs enough activity in the period — at least 50 prompts and 7 active days.
- Under Show on the card, choose whether Your name and Estimated spend appear. Project names is off by default, so a card says how many projects rather than naming them.
- Copy image, Save PNG… or Copy text.
Cards carry aggregate numbers only. Prompts and session titles are never included, and nothing is uploaded until you paste or post the card yourself.
Settings → Analytics
- Default range — the range Analytics opens on.
- Share recap defaults — the Card style and Period a new recap starts with, and whether it shows your name (with a Display name that defaults to your git user name), estimated spend and project names.
- Analytics cache — Reset cache clears computed sections from memory and disk. Your agent logs, prompt history and git are untouched.
Related
- AI Usage & Quota — live quota and reset times while you work
- Spend & Quota Center — headroom and spend for every AI account
- Resume Sessions — reopen the sessions Analytics counts
- Orchestration Dashboard — the full record of orchestration runs